


Where did Chinese tourists go in 2019, and what were the biggest trends in the way they traveled and the top digital developments? Make sure you’re up to date and ready for 2020 with this essential overview of the past year.
World Markets
Generally speaking, the largest outbound tourism market continued to grow in 2019 – by 12%, according to the China Tourism Academy. But while some countries and regions saw a significant increase in Chinese visitors, others experienced stagnation or decline.
The following statistics on arrivals growth comes from data released by the respective country’s national tourism board, or news articles reporting on data from the national tourism board.
Greater China
The region with the most dramatic declines in mainland Chinese tourism was Greater China, specifically Hong Kong and Taiwan. A little less than half of all outbound trips from the Chinese mainland end in Greater China, and mainland Chinese constitute a huge proportion of the inbound tourism markets in these destinations.
Tourism to Hong Kong has been ravaged by ongoing protests in the city since last summer, with no sign of recovery in sight. Tourism from mainland China was down by around half over the October holiday period, with group tourism down by over 80%. The Hong Kong Tourism Board has suspended nearly all marketing on Chinese social media platforms WeChat and Weibo.
Tourism to Taiwan has also been devastated, after the mainland government stopped citizens from being able to apply for an independent travel permit to Taiwan in August. After restrictions on group travel a few years ago, Taiwan had shifted their tourism strategy to focus instead on FITs from the mainland, with really successful results, so this is a major blow. October showed a 50% year-on-year decrease in mainland Chinese arrivals, the biggest decrease in 11 years.
One bright spot in Greater China is Macau, which enjoyed a 19% increase for January-August 2019, but may now be experiencing a spill-over effect from reduced travel to Hong Kong, as there was an 11.1% decline in mainland Chinese tourism in November.
Asia
The situation in the rest of Asia is much more positive, with some short-haul destinations probably attracting visitors who may otherwise have gone to Hong Kong.
Despite the strong Baht, Chinese tourism to Thailand made a comeback by the end of summer, with numbers up 1.71% in the first nine months of the year. Vietnam also recovered from an early-2019 dip, with a 4.4% increase in Chinese tourism in the first nine months. Declining travel to Hong Kong and a new 72-hour visa-free policy attracted tourists to Singapore, with 5% growth in the first nine months.
Japan saw a significant growth of +15.8% in Chinese tourism arrivals in the first nine months of 2019, and it pulled ahead of Thailand as the most popular outbound destination for Chinese tourism over the October holiday period. Tourism to South Korea, which dropped significantly in 2017 because of the ban on group tourism and cruises from China, is recovering substantially, with a 27.1% year-on-year increase as of September.
Other destinations around Asia, The Philippines (+41.5% in the first 10 months), Cambodia (+33% in the first eight months) and Myanmar (+164% in the first nine months) saw major growth.
Oceania
Oceania is a mixed picture. Despite 2019 being the New Zealand-China Tourism Year, Chinese tourist arrivals to New Zealand (where China is the second-largest inbound market after Australia) were down 11.1% as of October. However, COTRI research has shown that there is almost never a correlation between an official “tourism year” and growth in the Chinese market.
Although there was significant media coverage of a “slump” in Chinese tourism to Australia, according to data from the Australian tourism board, Chinese arrivals were actually up 3.1% as of September – this isn’t the kind of rapid growth we saw earlier in the decade, but it’s not particularly worrying either. That said, there have been cancellations for the Chinese New Year period because of the Australian bush fires, so 2020 brings new challenges.
North America
North America is the long-haul market with the biggest declines in Chinese tourism – this is affected partially by political factors, as well as a weakening of the RMB against the US dollar, and stricter visa policies from both the US and Canada. Chinese tourism to the US, which already declined in 2018, was down by another 6.5% in the first nine months of 2019. Meanwhile, Chinese tourism to Canada was down by 10% as of October.
It’s important to note, however, that the US still received 2.35 million Chinese visitors during this time, and Canada over half a million. The US, like Australia and New Zealand, is still one of the most popular long-haul destinations for Chinese tourists.
Europe
Chinese tourism to Europe continued steadily in 2019, with Southeastern Europe in particular standing out as a new hotspot, and surging Chinese arrivals to countries like Montenegro, Serbia, Croatia, and Slovenia. Read our article, The Southeastern Europe Chinese Tourism Boom for more information.
2019 also saw increased connectivity between China and Europe, with new flights to Norway, Hungary, Italy, Finland, France, and Portugal, among other destinations.
Middle East
Though the situation is much less certain now, with many cancellations to the whole region following the early January 2020 US assassination of Iranian general Qasem Soleimani, 2019 was a strong year for Chinese tourism growth to the Middle East, with a 14% increase in arrivals to the UAE in the first nine months of the year; a 42% increase in visitors to Oman in the first half of the year; and 17% growth to Jordan. Chinese tourism numbers to Israel have recovered significantly in 2019, with a 39.1% year-on-year increase from January-November. Since Saudi Arabia started issuing tourist visas at the end of September, 2019, China has been its second largest source market of international visitors, after the UK, and a recent survey revealed that around one-third of Chinese millennial travelers were interested in visiting the Saudi UNESCO World Heritage site of Al-Ula.
Africa
Africa remains a niche market for Chinese tourism, and Chinese still have security concerns about the continent, but visitation continues to grow, and there is high potential for “new” destinations like Rwanda, Uganda, and Namibia. The Chinese ambassador to Egypt puts Chinese arrivals at more than 500,000 for 2019; South Africa received around 100,000+ Chinese tourists; Tanzania received approximately 10,000; and Rwanda received around 8,000 Chinese tourists in 2019.
South America
South America was a big winner in 2019, especially picking up on long-haul travel as tourism to North America declined. Tourism boards in this part of the world have also put significant and sustained efforts into marketing to Chinese tourists and the travel trade, and this work is paying off. Chile and Bolivia experienced some short-term challenges, but overall Chinese travel to Chile grew in 2019. Now offering visa-free travel, Brazil also saw a growth in Chinese arrivals. Peru is one of the leading countries in the region, with a growth in Chinese tourists in 2019 of more than 30,000.
Market Trends and Behavior
Trips: Longer and More Frequent
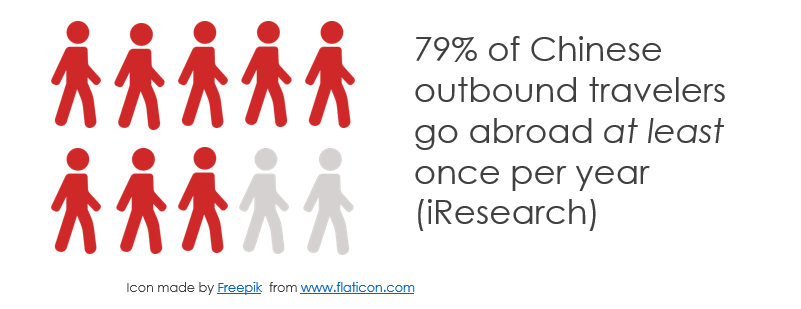
The Chinese outbound tourism market has matured considerably since its start at the end of the 1990s, and we’re now seeing many regular outbound travelers. According to iResearch, nearly 80% of Chinese outbound travelers are now going abroad at least once a year, with 45% traveling abroad more than once a year. Travel website Mafengwo, which focuses on independent travelers and has an audience that’s majority millennial, reported similar numbers – they found that 48% of Chinese outbound travelers are going abroad more than once a year.
These trips are not only becoming more frequent, but also longer. OTA Tuniu found that in 2019, the average length of FIT trips is now eight days or more, which is between half to one day longer than in previous years. Data from both iResearch and Mafengwo showed that the large majority of Chinese outbound tourists are traveling for more than five days at a time.
Customized Travel
Customized travel was already a buzzword in Chinese outbound tourism in 2018, and it continued to be in 2019 (and is sure to be again in 2020). More travelers are now eschewing large tour groups and choosing instead to travel in multi-generation family groups, or with several families traveling together. Both OTAs and traditional travel agencies have done a lot to develop products for the growing small group and customized tour segments, with products for couples and solo travelers as well as families, comprising many themes and interests, including photography and adventure tourism.
Slowing Down, or Ticking Boxes?
Another continuing trend in 2019 is a focus on the cultural aspects of travel, including seeing how local people live and visiting cultural attractions. In H1 2019, outbound travel search for museums on Mafengwo increased by 41% compared to the year before, while searches for shopping decreased by 11%. Outdoor adventure experiences also continue to gain in popularity. These trends indicated that many Chinese tourists now want to do something different than the generic site-seeing and shopping-focused itineraries that used to be the norm.

QR code displayed at Madrid’s Thyssen-Bornemisza Museum, to access a WeChat-based guide
However, one major Chinese tourism trend of 2019 seems like an updated throwback to the old fashioned style of rushed, box-ticking travel, and this is daka (打卡) tourism. Daka translates literally as “punch card”, and it’s about checking into a must-visit tourism site, by taking a photo or video to show you were there on social media. It’s a major phenomenon for young people doing domestic tourism in China and has led to some places being overwhelmed by visitors who have to get the photo. We are now starting to see the phrase “daka” used more and more often for outbound travel, to refer to the must-see places, including landmarks, attractions, and pop-up stores or installations.
Digital Trends
Mobile Payments
At the end of January 2019, it was revealed that 2018 was the first year in which more payments were made overseas by Chinese using mobile payments (32%) than with cash (30%), but bank cards (38%) were still the leading form of payment. We’ll have to wait for 2019 data to be released to see if this past year marked the first time that mobile payments were the most popular form of payment, but what we do know is that mobile payments overseas grew throughout 2019. According to China’s State Administration of Foreign Exchange, mobile payments abroad doubled in H1 2019 compared to the year before. Alipay reported an 11% year on year increase in overseas transaction volume during the May holiday in 2019, and a 14% increase during the October holiday.
Short Video and KOL Marketing
Short video continued its upward trajectory in 2019, even for B2B as a resource that Chinese travel agents can share with their clients. By September 2019, there were 810 million active short video users in China, a 25% year on year increase. The penetration rate is already 70% (China Internet Watch).
There’s also a crossover between short video and KOL marketing, as vlog viewers in China doubled to 249 million in 2019. Vlog viewers are predicted to grow by another 47.8% in 2020, to 328 million (iiMedia Research). A majority of KOLs now create video content in addition to photos and writing. Although there are many short video platforms in China, Douyin (the Chinese version of TikTok) continues to grab headlines and grow users – they reported 400 million daily active users in their year-end report for 2019.
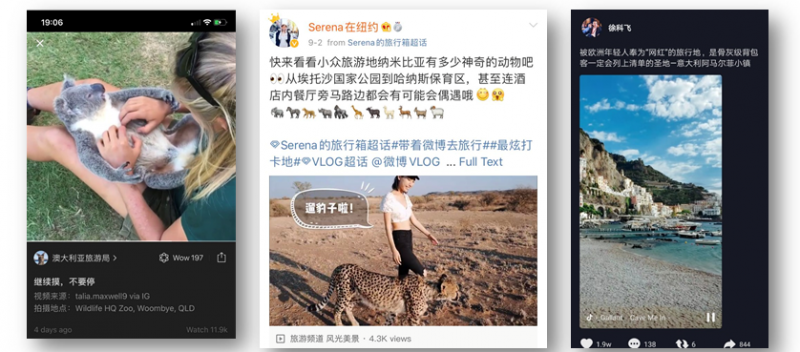
Left to right: A short video of a koala shared by Tourism Australia was a hit with WeChat users; A vlog posted on Weibo by a KOL, of her trip to Namibia; and a Douyin video from Italy with close to 20,000 likes.
The Digitization of Travel Booking
Travel booking is increasingly digital, and mobile, for Chinese consumers. This includes OTAs – which grew their users by 65% in H1 2019, driven by strong growth (+75%) from third- and fourth-tier cities – and traditional travel agencies like CAISSA and UTour. Chinese travelers are more digitized than other nationalities: 82% use mobile booking platforms, compared to a 54% global average. 74% prefer mobile for all trip planning and booking, compared to 48% globally.
Chinese tourists are also increasingly likely to still be booking travel products on the road and in the destination – on Mafengwo, booking while traveling increased by 40% in H1 2019 compared to H1 2018.
Want to know how your tourism brand can keep pace with Chinese travel and marketing trends, including short video and KOL marketing, as well as working with the Chinese travel trade? Browse our services, check out case studies of our work, and get in touch to discuss your goals directly with our team.
For monthly updates on Chinese outbound tourism and digital developments, subscribe to our newsletter.
The wonderful partners we work with


Sign up for our free newsletter to keep up to date on our latest news
We do not share your details with any third parties. View our privacy policy.
This website or its third party tools use cookies, which are necessary to its functioning and required to achieve the purposes illustrated in the cookie policy. If you want to know more or withdraw your consent to all or some of the cookies, please refer to the cookie policy. By closing this banner, scrolling this page, clicking a link or continuing to browse otherwise, you agree to the use of cookies.