


Executive Summary:
Dragon Trail Interactive’s WeChat Rankings Report for Q3 2019 reveals the top travel brands and overall trends on WeChat in terms of national and regional tourism boards, airlines, cruise lines, museums & attractions, and international hotels. In the DMO, airline, and museums & attractions categories, we can see the impact of Hong Kong protests on Chinese tourism marketing, as leading accounts in each category have paused their WeChat activities in recent months. NTOs saw continued success for Japan, as well as a good quarter for Australia, and Vancouver has ascended even further in the DMO category. All Nippon Airways is a strong performer among airlines, while Dream Cruises topped the cruise line rankings for the first time. Among museums, NYC’s Museum of Modern Art has made tremendous gains over the past year, gearing up for the museum’s reopening in October, 2019. Nature and wildlife, romance, and travel with children all stood out as popular themes across multiple categories.
NTOs
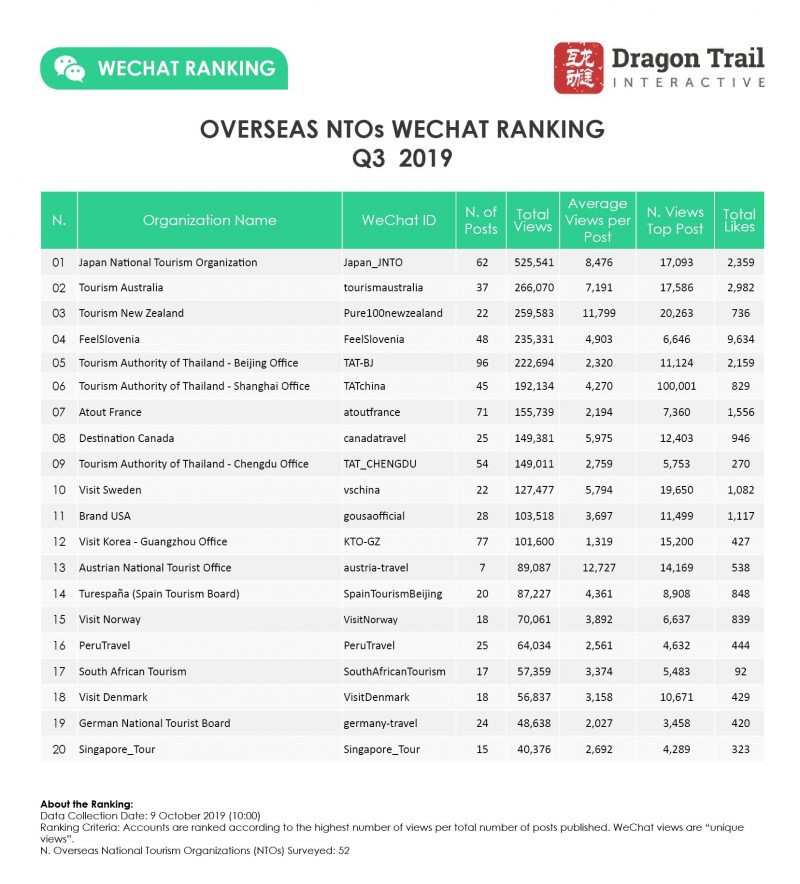
For NTOs, Japan holds onto the no. 1 position for the seventh quarter in a row. While Japan is one of the leading outbound destinations for Chinese tourists, the team behind the WeChat account is working hard, posting 62 times in Q3 – far higher than the average 37 posts for the top 20 NTO accounts, and higher than the Japanese National Tourism Board’s 51 posts from Q2.
Tourism Australia had an extremely successful quarter, rising from 4th place in Q2 to 2nd, and increasing total and average views for their content while posting slightly less. Their winning theme for the quarter was animals, with leading posts on kangaroos, quokkas, and koalas, as well as nature-themed posts on stargazing and springtime.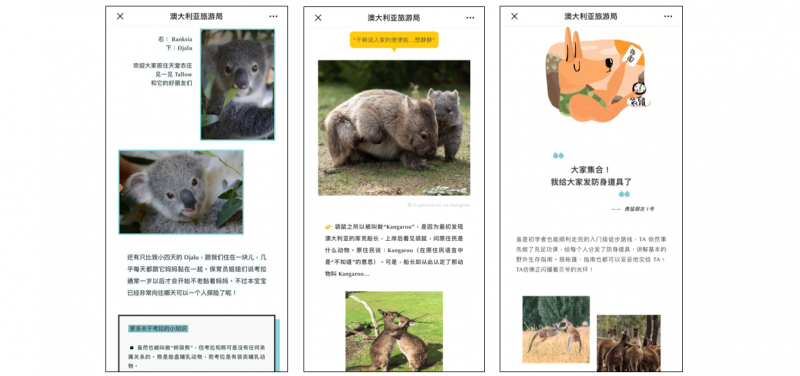
Wildlife was the leading theme for Tourism Australia’s WeChat content in Q3 2019
The most-viewed post for the quarter, with over 100,000 views, was the Tourism Authority of Thailand Shanghai Office’s article on romance in Thailand. New Zealand, as always, had the highest average views per article, and published the second most-viewed article at the end of September, with 20,263 views for a post on the colors of springtime. While only ranking in 10th overall , Visit Sweden published some of the most-viewed articles of the quarter, on rural life in July, and autumn foliage in September, both with more than 19,000 views.
While the Slovenian Tourism Board ranked 4th in terms of total article views, we have some reservations about the account’s activities, based on an abnormal number of likes that suggests artificial promotion methods. The average number of likes for the top 20 NTOs in the quarter was 1,402, and Australia received the second highest amount, at 2,982. Meanwhile, Slovenia received a staggering 9,634, which contrasts starkly with the 133 total likes the account’s articles received in Q2 2019 – an increase of over 7,000% from one quarter to the next.
One more notable piece of data is that this is the first quarter ever in which a South American tourism board has reached the top 20 NTOs, with PromPeru ranked in 16th place.
DMOs
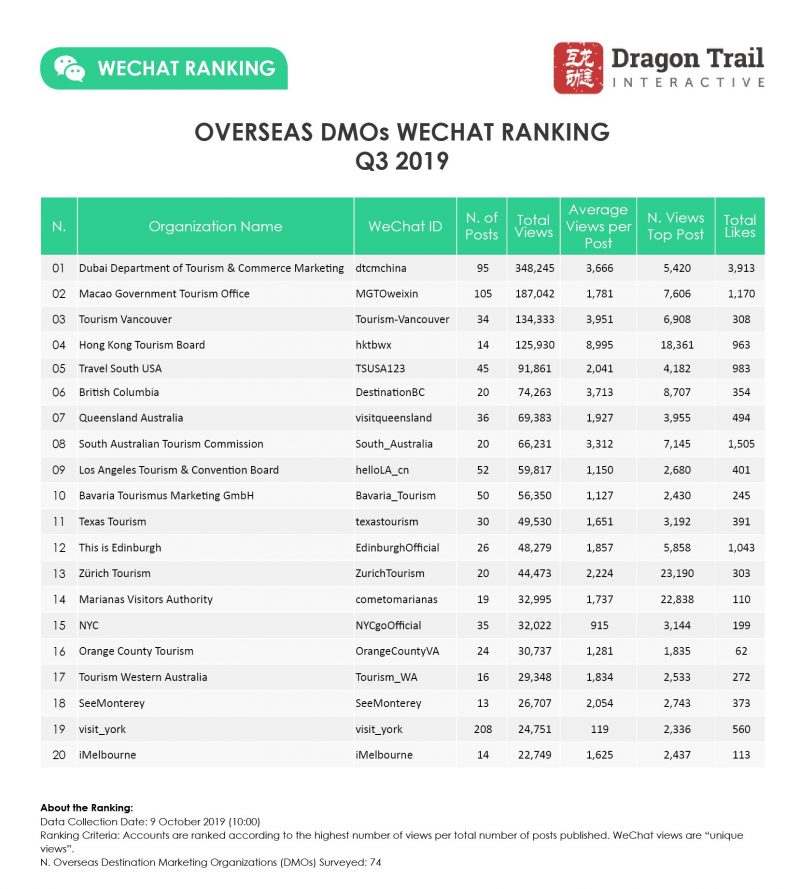
The state of mainland Chinese tourism to Hong Kong is grim, and during the months of unrest in the region, the Hong Kong Tourism Board has stopped posting on WeChat altogether since August 8, with only 14 articles in Q3, compared to 35 in Q2. Despite this, high follower numbers for the account still mean that they ranked 4th for the quarter, and even had slightly higher average views per article this quarter than last, as well as higher average views than in Q3 2018. Obviously, this attention was concentrated in the earlier part of the quarter, with 18,361 views for an article on the Hong Kong Book Fair at the start of July. Other leaders in the DMO category, Dubai and Macau both increased their average article views in Q3 as well.
Several North American accounts had notable success in Q3. Vancouver ranked 3rd, up from 5th in Q2. Ranked 20th among DMOs in 2017 and then 5th in 2018, the Canadian city’s WeChat account goes from strength to strength – this quarter they published popular articles on parks and nature tours, as well as local seafood.
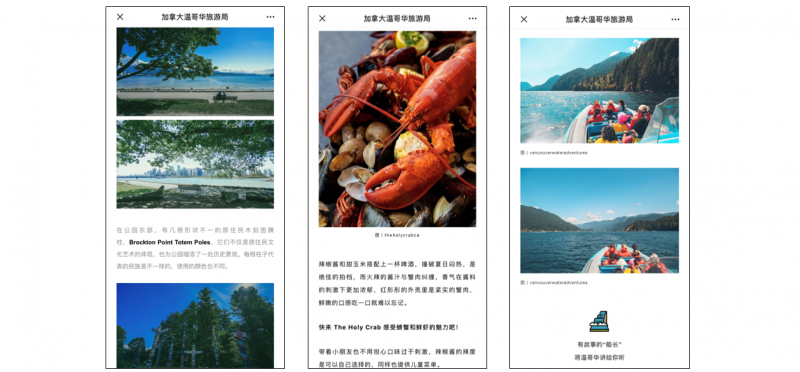
Vancouver has become one of the strongest DMO tourism accounts on WeChat
The top three articles of the quarter were Zurich’s post on Swiss National Day (23,190 views), the Marianas Islands’ announcement of visa-free travel for Chinese tourists (22,838 views), and Hong Kong’s previously mentioned article on the book fair.
Airlines
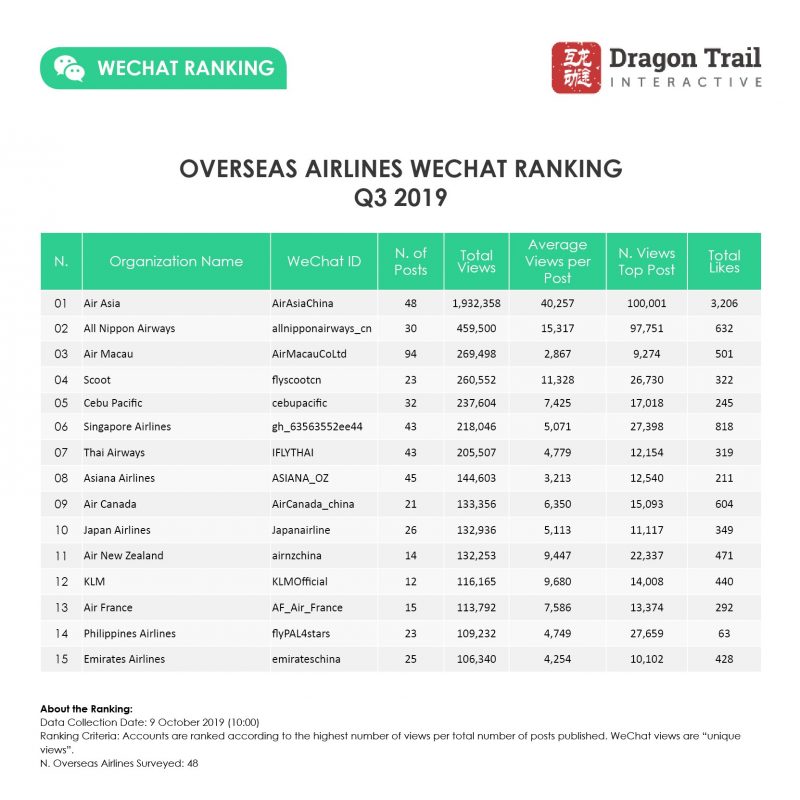
As always, AirAsia stood out among airlines, with nearly four times the total article views of its nearest competitor. However, AirAsia’s total views for this quarter were down by 2.2% compared to Q3 2018, and down 12.3% since Q2.
All Nippon Airways, in 2nd place, has shown a lot of growth in the past year. Total views for the quarter are up 56.8% year on year, from 293,005 in Q3 2018, and up 19.2% from Q2 2019. The Japanese airline has attracted views with a number of small giveaways of items like branded bags and pens, discounted fares, and cute illustrations.

All Nippon Airways’ frequent giveaways help attract readers to the WeChat account
Another casualty of the current political situation in Hong Kong, Cathay Pacific stopped posting on WeChat after July 18, and dropped in the rankings from 4th place in Q2 to 16th in Q3.
Cruise Lines
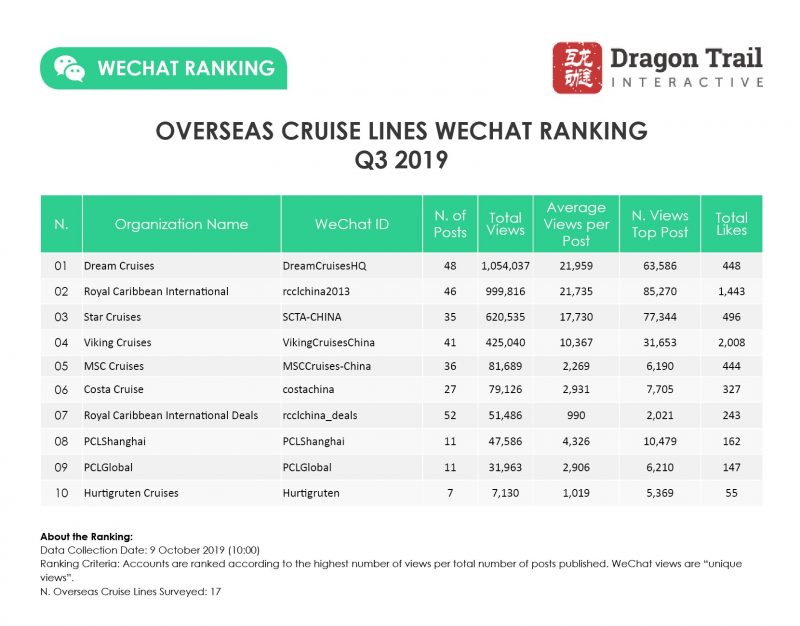
Q3 2019 marks the first quarter since Dragon Trail started tracking tourism brands’ WeChat accounts nearly three years ago, in which Royal Caribbean International was not the leading cruise account. Narrowly edging them out by just 54,000 views is Dream Cruises. The two accounts posted almost the same number of times and have nearly the same average views as well. And while Royal Caribbean may have slipped slightly in the rankings, its total views and average views have both increased since last quarter, and compared to Q3 2018. Both of these leading accounts do post more articles that the average top 10 cruise lines – 48 and 46 posts, respectively, compared to an average of 31.
Dream Cruises’ ascent is impressive. Compared to Q3 2018, they increased total views by 325% and average views by 431%. The brand has developed a more sophisticated and consistent illustration style for its posts since last year, and has many more promotions with the prices of cruises included in the article headline than in the past.
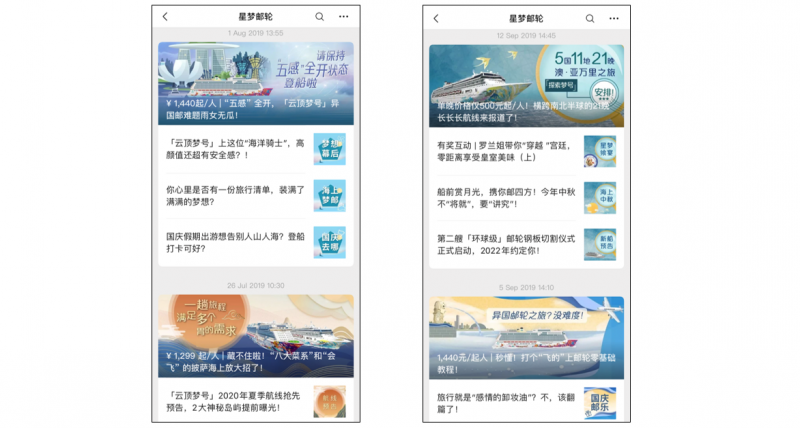
From 2019, Dream Cruises has adopted a more uniform, sophisticated design, while also starting to include prices in article headlines
The top three cruise line posts of the quarter were Royal Caribbean’s article on a special deal for families in August (85,270 views), and sales from Dream Cruises (77,344 views) and Star Cruises (63,586 views) in the first week of July.
Museums & Attractions
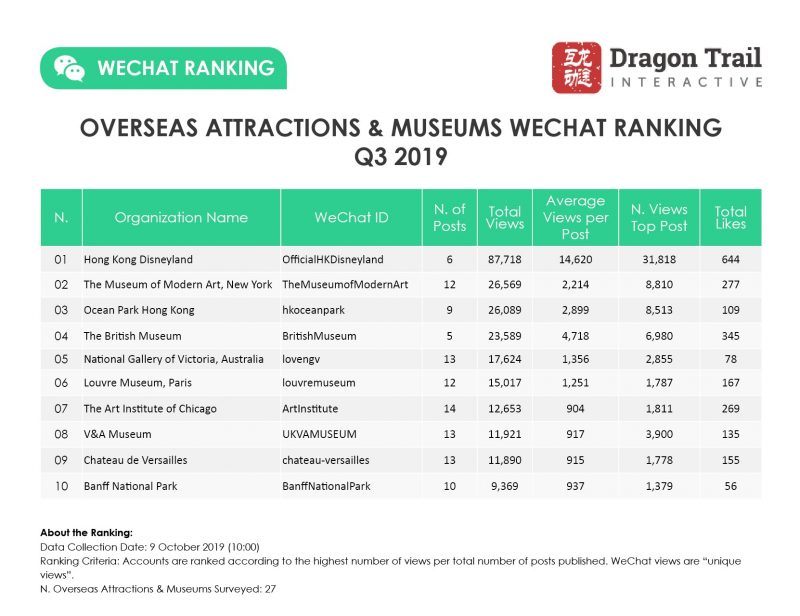
The Museums & Attractions category is yet another area where we can see the impact of the Hong Kong protests on tourism marketing, as well as the enduring popularity of Hong Kong travel brands on WeChat despite current circumstances. Hong Kong Disneyland posted only six times in Q3, compared to 23 posts in the previous quarter, and total views fell by 65.8%, but it still managed to rank in 1st place. The theme park’s average views per post rose by 31.3% compared to the previous quarter, and the account broke nearly two months of silence in mid-September to celebrate the theme park’s 14th anniversary – their most-viewed article of 2019 so far. Unlike the Hong Kong Tourism Board, Cathay Pacific, and Disneyland, Hong Kong’s Ocean Park has continued to post throughout the summer, with only a slight decline in average article views.
Outside of Hong Kong, it’s been a spectacular quarter for NYC’s Museum of Modern Art, as the museum geared up for its reopening on October 21. This is the first quarter since we’ve tracked museums and attractions (from April 2018) that a museum – not a theme park – has ranked in 2nd place. From Q2, MoMa increased total article views by 72%, and average article views by 57.7%. Even more impressive, total article views for Q3 2019 were up by over 200% compared to the same quarter in 2018, with average views increasing by over 250%. MoMA’s top article for the quarter, about the history of the museum, had almost exactly the same number of views as all of MoMA’s articles combined in Q3 2018.

A post about “MoMA Through the Ages” got more than 8,000 views
The British Museum and National Gallery of Victoria remained strong museum accounts, as did the Art Institute of Chicago. The Louvre cut down on the number of articles posted and subsequently dropped from 3rd place to 6th. Both the British Museum and the Metropolitan Museum of Art now have stores on China’s e-commerce site, Tmall, which attracts attention on WeChat and helps to raise awareness for the museums’ brands – as well as revenue for the museums.
Hotels
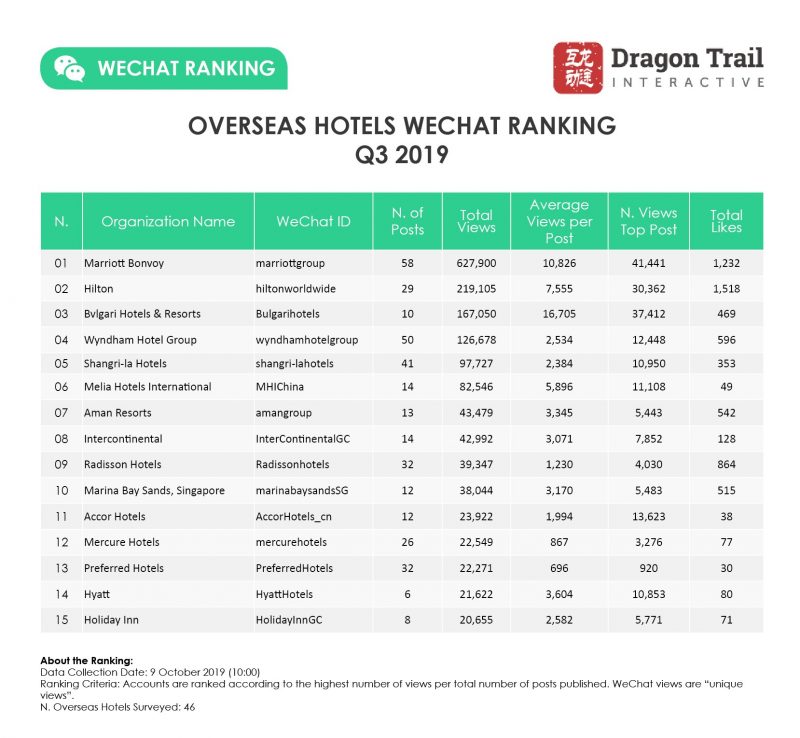
The hotel category has seen one major change this quarter, but this is due to a major expansion of Dragon Trail’s ranking database rather than the accounts themselves. In Q2 2019, our rankings included 21 hotel accounts. For Q3, this more than doubled to 49 accounts. As always, Dragon Trail welcomes input on any travel brands that might be missing and should be added to our database – please contact us directly with suggestions or queries.
Despite this significant change, the Marriott Bonvoy account remains in 1st place, increasing both total views and average views by 42.6% each compared to the previous quarter. Hilton rose to 2nd place from 3rd by increasing the number of articles posted – the average views were consistent from quarter to quarter. Newcomers to the rankings, Bvlgari Hotels and Wyndham Hotels took the 3rd and 4th spots, and Shangri-La Hotels dropped down one ranking to 5th place. Melia Hotels, which had been performing strongly in 2019, had a weaker third quarter on WeChat and ranked 6th instead of 2nd. Their total article views fell by 135% from one quarter to the next.
The top three hotel posts of the quarter were an announcement of the opening of the new JW Marriott in Shanghai (41,441 views), a video featuring model and actor Hu Bing by Bvlgari Hotels (37,412 views), and a post on the Hilton Honors App (30,362 views).

Bvgalri Hotels’ short video featuring model and actor Hu Bing
Cross-category Themes
A few themes stood out across categories this quarter. As in the first half of the year, romance-related posts continued to attract views this summer, including promotions for Chinese Valentine’s Day by cruises and hotels, and articles on romantic occasions in Thailand, Dubai, and New Zealand, and a love-themed article by the British Museum.
Family travel was heavily promoted in July at the start of the school holidays, with high-performing articles on traveling with children from attractions, cruise lines, and destinations. As the seasons changed, northern hemisphere accounts attracted views for posts on autumn foliage, while southern hemisphere destinations focused on the beauty of springtime.
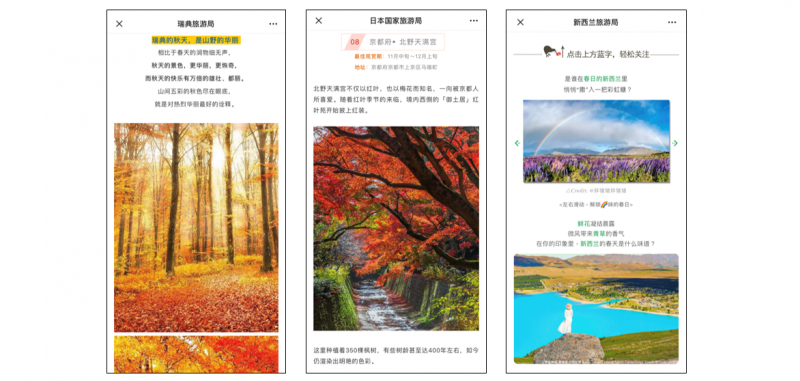
Seasonal posts by (left to right) Visit Sweden, the Japan National Tourism Organization, and Tourism New Zealand
Dragon Trail’s consumer marketing services include opening and managing WeChat accounts and other Chinese social media platforms, video production, website creation and hosting, online campaigns, and more. Please see our Services page or contact us at communications@dragontrail.com for more information on how we can help you to reach Chinese travelers online.
The wonderful partners we work with


Sign up for our free newsletter to keep up to date on our latest news
We do not share your details with any third parties. View our privacy policy.
This website or its third party tools use cookies, which are necessary to its functioning and required to achieve the purposes illustrated in the cookie policy. If you want to know more or withdraw your consent to all or some of the cookies, please refer to the cookie policy. By closing this banner, scrolling this page, clicking a link or continuing to browse otherwise, you agree to the use of cookies.