Dragon Trail International’s Xiaohongshu/RedNote Rankings tracks and analyzes performance for national tourism organizations (NTOs), destination marketing organizations (DMOs), airlines, cruise lines, museums & attractions, hotels, and car rentals. The quarterly report builds industry benchmarks and uncovers best practices in digital marketing in the travel sector.
Most travel categories saw strong year-on-year growth in average engagements per post on RedNote/Xiaohongshu in Q1 2026, driven by improved content efficiency. Celebrity content, practical travel tips, information on concerts, and giveaways all stood out as engagement-boosting post themes.
Average Engagements per Active Account per Post: Q1 2025 vs. Q1 2026
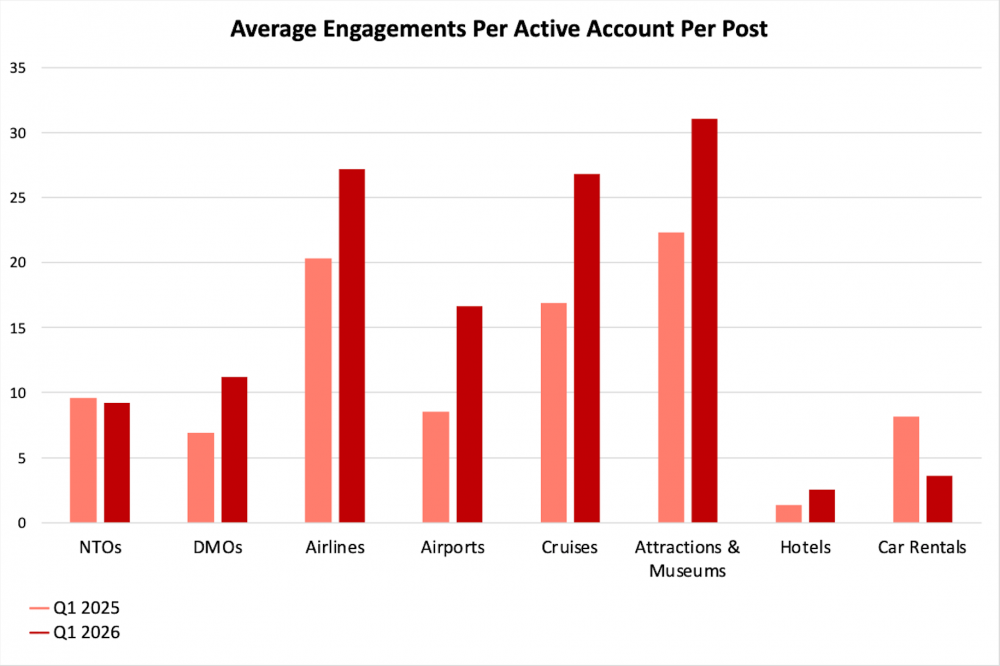
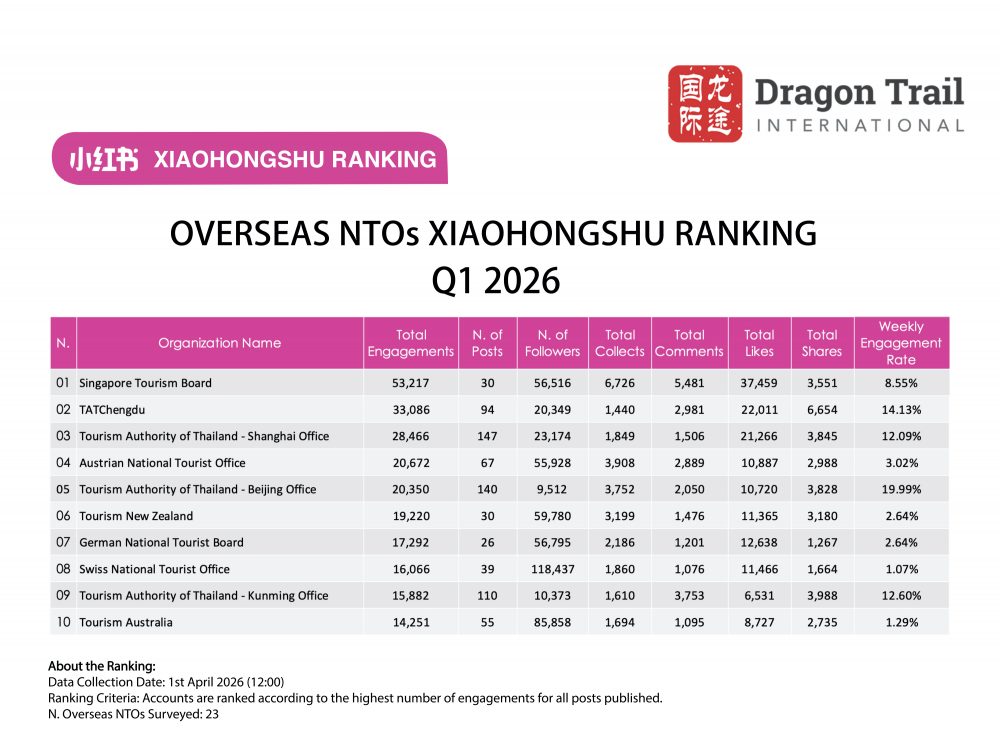
In Q1 2026, the Singapore Tourism Board climbed from fourth place in Q1 2025 to first place, with total engagements surging from 8,533 to 53,217, representing a 523.7% increase year-over-year. Its average engagements per post also rose by 378.14% over the same period. Meanwhile, Tourism Australia, which ranked first in Q1 2025 with 37,766 engagements, dropped out of the top three to 10th place in Q1 2026, recording 51.97% decrease in average engagements per post over the same period. The Tourism Authority of Thailand further strengthened its presence, expanding from two regional offices in the Q1 2025 rankings to four offices in Q1 2026, with its Beijing Office recording the highest engagement rate at 19.99%. In contrast, the Swiss National Tourist Office fell from second place in Q1 2025 to eighth place in Q1 2026 despite similar posting frequency. VisitBritain fell out of the ranking from third place in 2025 to 11th place in 2026, recording a 16.91% decrease in average engagements per post. European NTOs such as the German National Tourist Board and the Austrian National Tourist Office continued to maintain visibility, while Oceania remained represented by Tourism New Zealand and Tourism Australia. Overall, the NTO category remained relatively stable, with average engagements per active account per post slightly declining by 3.9% year-over-year, from 9.58 in Q1 2025 to 9.21 in Q1 2026.
The most popular post in Q1 2026 was published by Visit Singapore and featured actor Dylan Wang collaborating with the Singapore Tourism Board during a visit to River Wonders at Mandai Wildlife Reserve, where he interacted with giant pandas and capybaras. Building on the campaign’s popularity, the tourism board later released a seven-episode video series featuring Dylan Wang exploring Singapore’s Peranakan culture, local cuisine, and key attractions. The video series achieved high engagements, contributing to the tourism board’s overall rise in engagements. Mandai Wildlife Reserve also published a detailed itinerary guide on its official website encouraging fans to “fully recreate Dylan Wang’s adventure” at the reserve.
 Singapore Tourism Board’s video series featuring Dylan Wang
Another highly popular video came from the Tourism Authority of Thailand – Chengdu Office and featured veteran artist Qu Ying on influencer Papi Jiang’s variety show Warm Welcome. During the program, Qu Ying humorously shared her experiences in Chiang Mai and playfully spoke in Thai-accented Mandarin. The show quickly went viral across Chinese social media platforms, prompting the tourism board to capitalize on the trend by launching the “Thai-Accented Mandarin Challenge” campaign, which invited audiences to participate online. The campaign was further amplified through a giveaway promotion, with the top five participants receiving special gifts from the tourism board.
DMOs
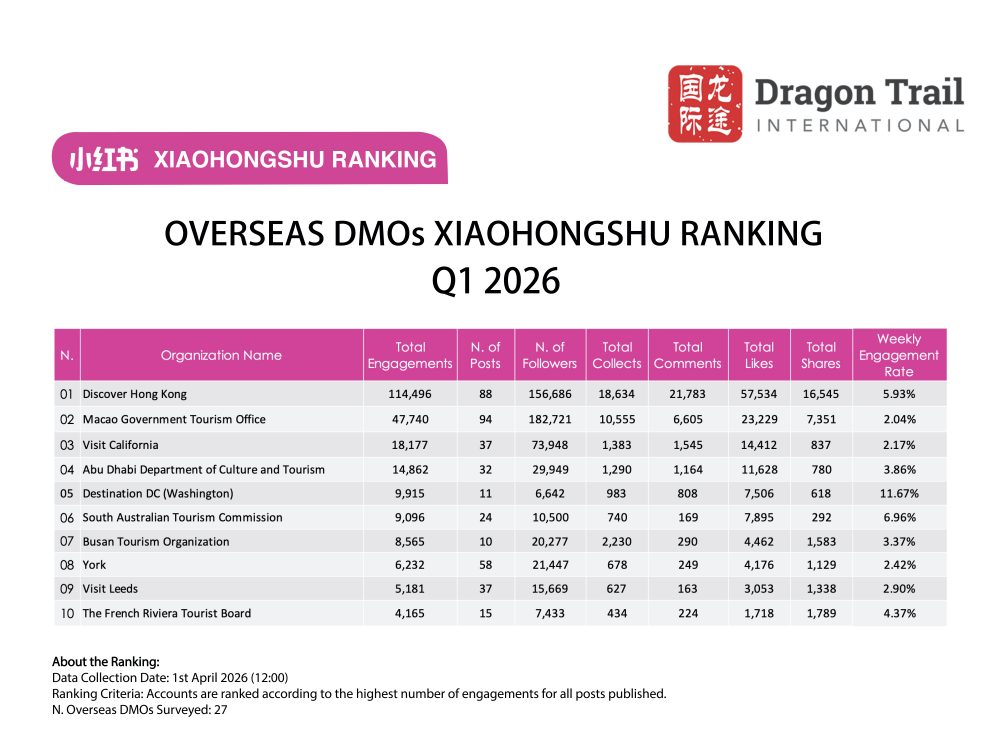
Between Q1 2025 and Q1 2026, Discover Hong Kong became the new leader after a 239.9% increase in total engagements (from 33,691 to 114,496) and a 282.4% rise in average engagements per post (from 340 to 1,301). Macao experienced a 31.0% increase in total engagements (from 36,453 to 47,740) and a 64.4% rise in average per post (from 309 to 508). Destination DC recorded a 334.9% increase in total engagements (from 2,280 to 9,915) and a 572.4% rise in average per post (from 134 to 901). York declined by 43.7% in total engagements (from 11,078 to 6,232) and 23.4% in average per post (from 140 to 107). Visit Leeds declined 17.6% in total engagements (from 6,287 to 5,181) but increased average per post by 38.1% (from 101 to 140), indicating greater efficiency. European DMOs dropped from five top-ten appearances in Q1 2025 (Edinburgh, York, Leeds, Zurich, Geneva) to two in Q1 2026 (York, French Riviera), while Asia-Pacific increased from three to four. Average posting frequency across all accounts fell from 40.0 to 32.2 posts per account (-19.5%), yet total engagements rose 80.6%, confirming a shift toward efficiency.
Concerts, live events, and fan giveaways emerged as the dominant themes among top-performing DMO content. Hong Kong’s three most popular posts centered on a ticket giveaway for Mayday’s 29th anniversary concert, Zhou Shen’s travel itinerary and concert in Hong Kong, and the annual Chinese New Year fireworks display over Victoria Harbour. Notably, the concert giveaway post alone generated more than 20% of the destination’s total engagements. Similarly, Macau’s top-performing content focused on upcoming concerts and performances during the Chinese New Year holiday period, supported by a ticket giveaway for Wang Sulong’s Macau concert. The destination’s other leading posts also primarily revolved around giveaways and lucky draw campaigns. Meanwhile, Destination DC experienced a significant surge in engagements following the announcement of Kun’s world tour, An Evening with KUN, which is scheduled to take place at Howard Theatre. The announcement post alone accounted for more than 84.7% of the account’s total engagements.
Airlines
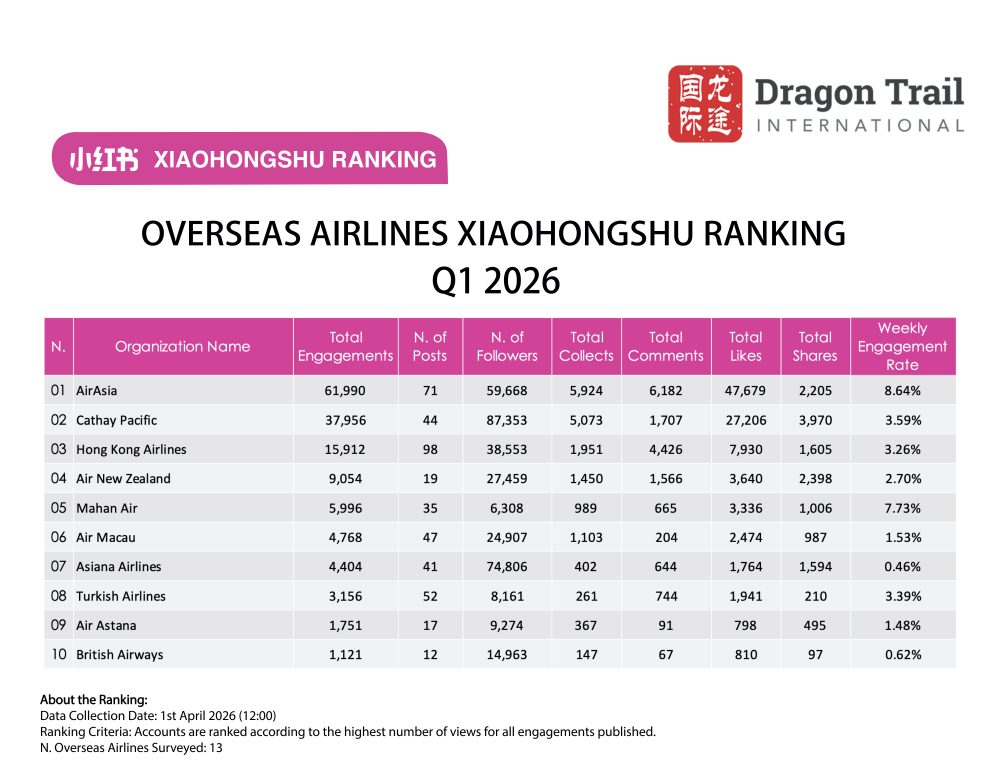
Airlines experienced a 33.5% increase in average engagement per active account per post, rising from 20.35 to 27.16. Among the nine airlines present in both Q1 2025 and Q1 2026, eight recorded increases in average engagement per post, with only Asiana Airlines declining. Air New Zealand achieved the highest increase at 866.6% (from 49 to 477), followed by Mahan Air at 646.2% (from 23 to 171), Air Macau at 260.1% (from 28 to 101), Turkish Airlines at 221.1% (from 19 to 61), Hong Kong Airlines at 153.1% (from 64 to 162), British Airways at 111.4% (from 44 to 93), Cathay Pacific at 79.4% (from 481 to 863), and AirAsia at 27.4% (from 685 to 873). Asiana Airlines declined by 64.2% (from 299 to 107). Air Astana entered the top ten list in Q1 2026, while Thai Airways dropped out. Average posting frequency across all accounts fell from 51.5 to 43.6 posts per account (-15.3%), yet average engagement per post across all accounts rose from 212.1 to 283.7 (+33.8%), confirming a shift toward efficiency. Asian carriers continued to dominate the top ten, occupying eight positions in both years.
Top-performing content from AirAsia featured Bo Yuan, the airline’s Chief Travel Experience Officer, promoting flights and destinations alongside exclusive interactive fan benefits. Meanwhile, Cathay Pacific generated strong engagement through content tied to its 80th anniversary celebrations, including the revival of its iconic vintage “Lettuce Leaf Sandwich” livery design originally used from the 1970s through the mid-1990s. Content related to the anniversary campaign collectively accounted for nearly one-third of the airline’s total engagements. Interestingly, Chinese New Year-related content did not generate engagement levels as high as non-holiday-related posts, despite the holiday representing one of the most significant travel periods for Chinese consumers.
Airports
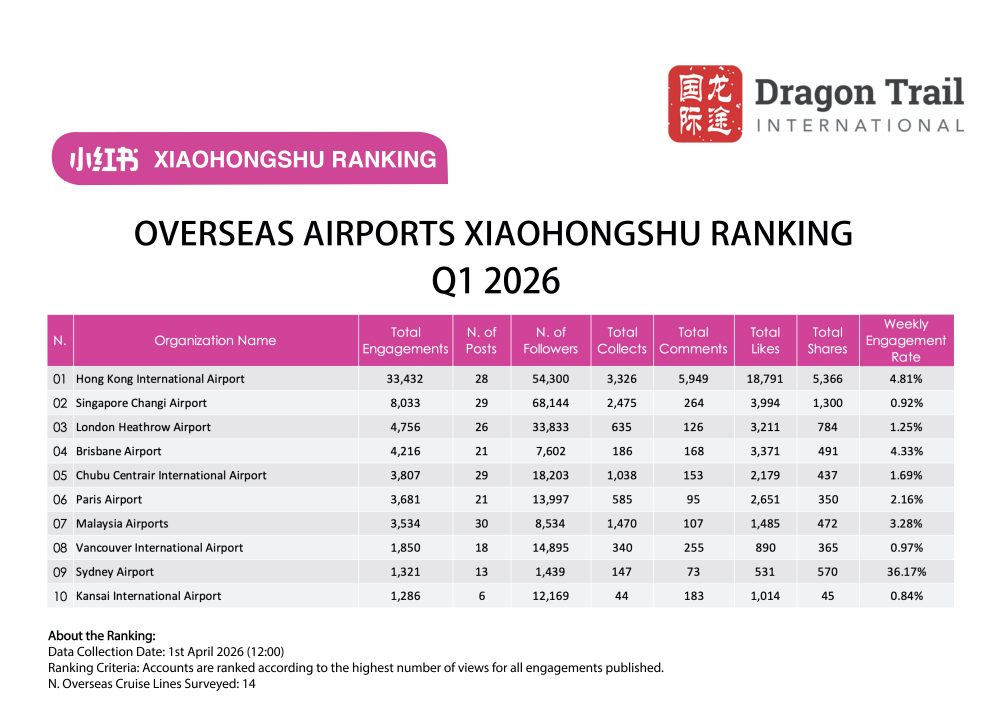
Airports experienced a 95.2% increase in average engagement per active account per post, rising from 8.54 to 16.67, which marked the highest year-over-year growth among all categories. Among the nine airports present in both Q1 2025 and Q1 2026, seven recorded increases in average engagement per post, with only Singapore Changi and Kansai International declining. Hong Kong International Airport rose to first place from 9th place, achieving the highest increase at 1,672.8% (from 67 to 1,194), followed by Brisbane Airport at 277.0% (from 53 to 201) and Malaysia Airports at 133.5% (from 50 to 118). Average posting frequency across all accounts rose slightly from 20.00 to 20.64 posts per account (+3.2%), yet average engagement per post across all accounts rose from 119.58 to 233.40 (+95.2%), indicating that efficiency gains were achieved despite a marginal increase in posting volume. Asian airports continued to dominate the top ten, occupying seven in Q1 2026.
The significant rise in engagements across the overall category was largely driven by Hong Kong International Airport’s collaboration with global pop star and hometown icon Jackson Wang as its first-ever celebrity ambassador. Launched on February 9, 2026, the campaign generated a total of 11,044 engagements, including likes, comments, and collects, accounting for approximately one-third of the account’s total engagements. However, a substantial portion of the comments was unrelated to Jackson Wang or the campaign itself. Instead, many users used the highly visible post to express frustration and demand responses regarding a widely publicized April 2026 incident in which a passenger’s delicate gold filigree artwork was severely damaged at the airport.
Hurtigruten Cruises replaced Viking Cruises as the third-highest performer after a 2,400.7% increase in average engagement per active account per post (from 5 to 115), followed by Viking Cruises at 103.3% (from 19 to 38) and MSC Cruises at 78.8% (from 41 to 74). Average posting frequency across all accounts increased from 60.3 to 69.3 posts per account (+14.9%), while average engagement per post across all accounts rose from 67.5 to 107.2 (+58.8%).
The most popular post from Hurtigruten Cruises — which also ranked as the top-performing post within the cruise category — featured a tutorial on the “three-layer” clothing strategy for polar travel. As Chinese consumers tend to conduct extensive research on polar gear requirements before booking such trips, practical educational content and travel guides like this generated significantly higher engagement than traditional promotional posts.
Attractions & Museums
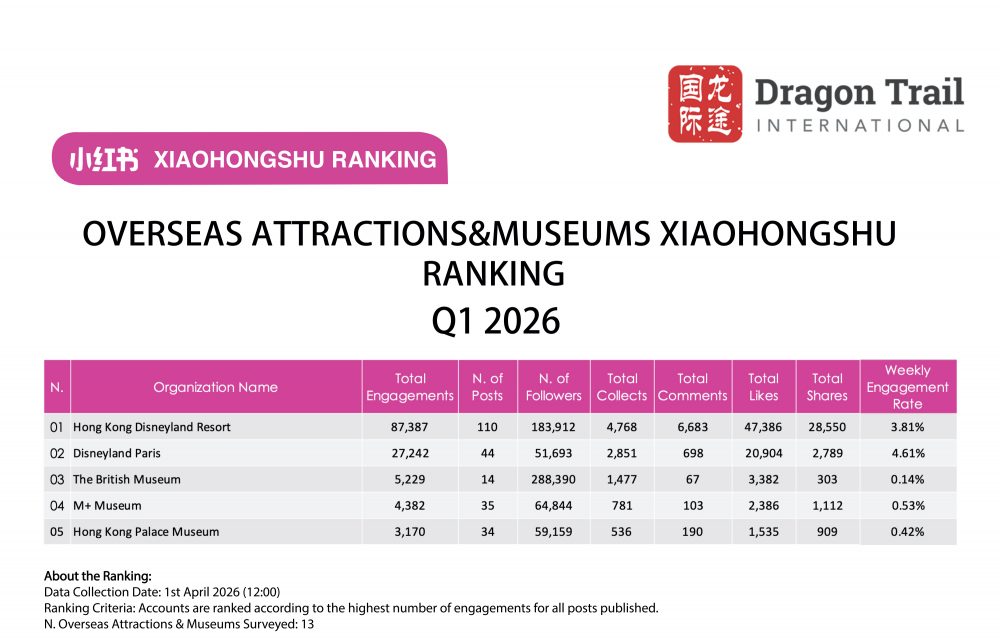
The attractions category recorded an average engagement per active account per post of 31.03 in Q1 2026. This marks a 38.9% increase from 22.35 in Q1 2025.
Hong Kong Disneyland Resort maintained its leading position, contributing 64% of the category’s total engagements in Q1 2026 (up from 63% in Q1 2025). Its average engagement per post increased by 19.2%, from 666 to 794. The British Museum recorded a 181.2% increase in average engagement per post (from 133 to 374), while M+ Museum declined by 77.4% (from 554 to 125). The National Gallery and Museum of Fine Arts Boston dropped out of the top five, replaced by Hong Kong Palace Museum.
The top 10 most popular posts in the attractions and museums category were all published by Disney accounts, with nine posts from Hong Kong Disneyland Resort and one from Disneyland Paris. Consistent with previous trends, the leading themes among attraction-related content included holiday celebrations — particularly Chinese New Year campaigns in Q1 — as well as upcoming events, limited-edition merchandise, and giveaway promotions. Within the museum sector, the top-performing post came from M+ Museum and announced the opening of Ryuichi Sakamoto’s exhibition, async-immersion.
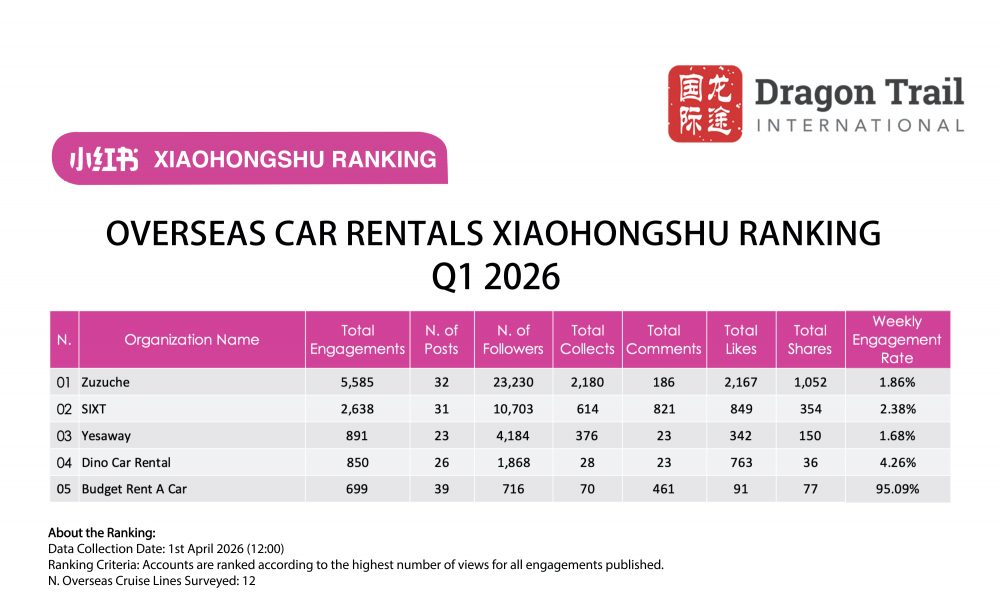
The car rentals category recorded an average engagement per active account per post of 3.63 in Q1 2026, marking a 55.6% decrease from 8.18 in Q1 2025. Zuzuche topped the chart after a 49.8% decrease in average engagement per post (from 348 to 175), overtaking EZU Car Rental which dropped out of the top five. Yesaway declined by 75.6% (from 158 to 39).



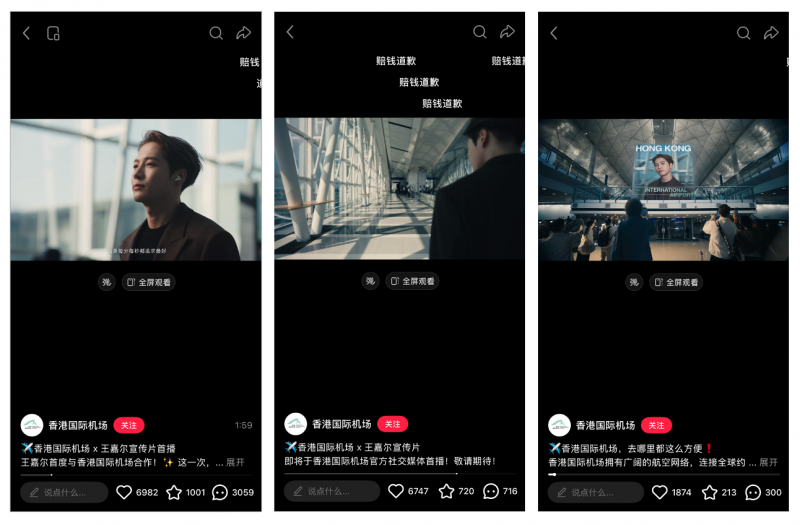 Hong Kong International Airport’s posts featuring Jackson Wang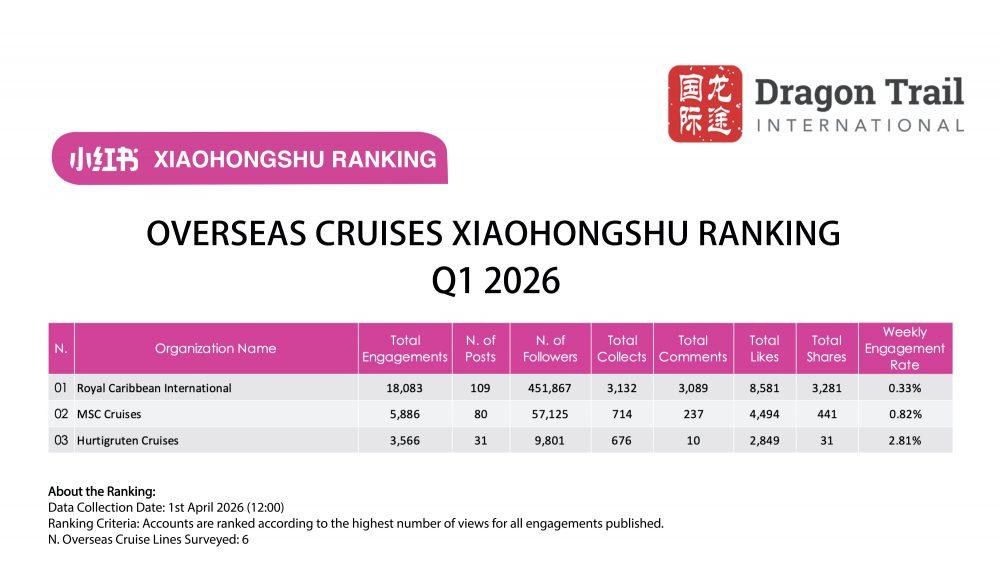
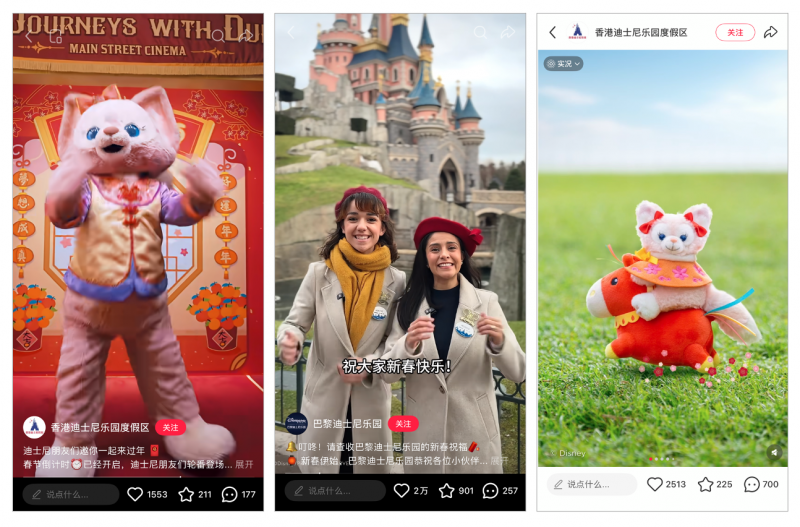 CNY-themed posts by Hong Kong Disneyland Resort and Disneyland Paris