


Dragon Trail’s August 2019 webinar featured guest speaker from the US National Travel and Tourism Organization (NTTO) Richard Champley, presenting an extensive market update on Chinese travel to the US. Looking at arrivals, visa data, travel destinations, transportation and more, Champley offered fresh perspectives on Chinese tourism to the US and its long-term prospects for growth.
Watch a recording of the webinar online, and contact us to receive the presentation slides.
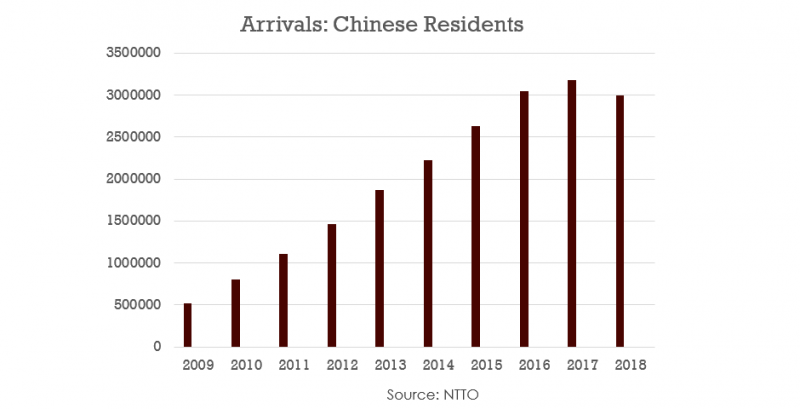
Arrivals
From record arrivals in 2017 (3.174 million), there was a 5.7% decline in Chinese arrivals to the US in 2019, to 2.992 million. In the first half of 2019, Chinese arrivals are down 3.1% (June YTD 1.429 million). Spending, including education spending, was $34.6 billion in 2018, a decrease from 2017. However, the NTTO is bullish and expects a trend of long-term growth, especially as the decline in 2019 so far has been less than the decline in 2018.
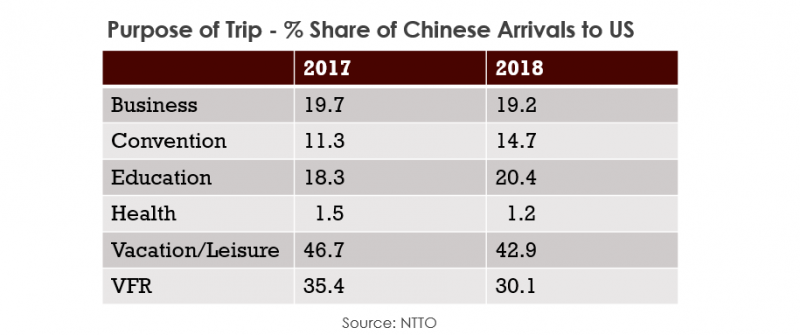
Data about purpose of trip shows a drop in both the vacation/leisure segment and VFR visitors from 2017 to 2018.
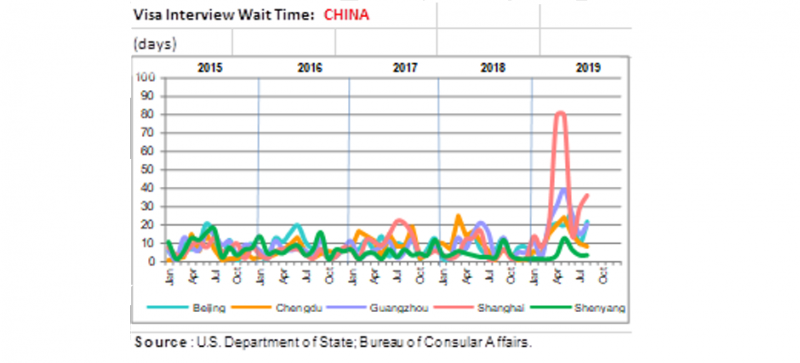
Visas
Interview wait times for Chinese applying for US visas were very high before 2015, then fairly stable until a period in 2019. This year’s spike coincides with the extension of China’s May 1 holiday, as well as staffing issues due to a 14-month hiring freeze because of the 2018 US government shutdown.
In the future, Chinese visa applicants will benefit from an expanding Shenyang visa office, as well as the opening of a Wuhan office in 2020.
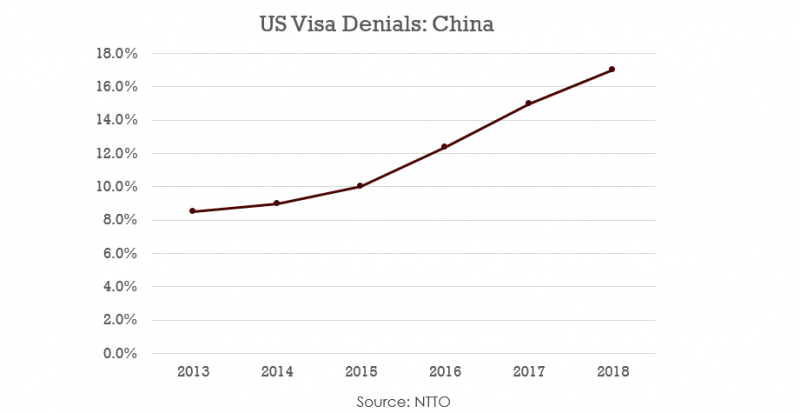
In 2014, visa validity was extended from just one year to 10 years. This helps to explain the decline in visas issued – in the first year or years after the 10-year visa, people might apply for a visa to “bank it” and have for when they need it in the future, without specific travel plans.
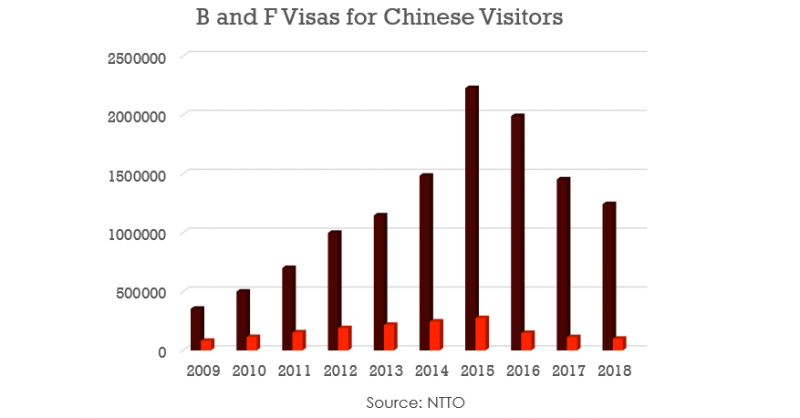
Visa denials are on the rise, but issuing a 10-year rather than a one-year visa involves more scrutiny from the US visa office.
Airline Capacity
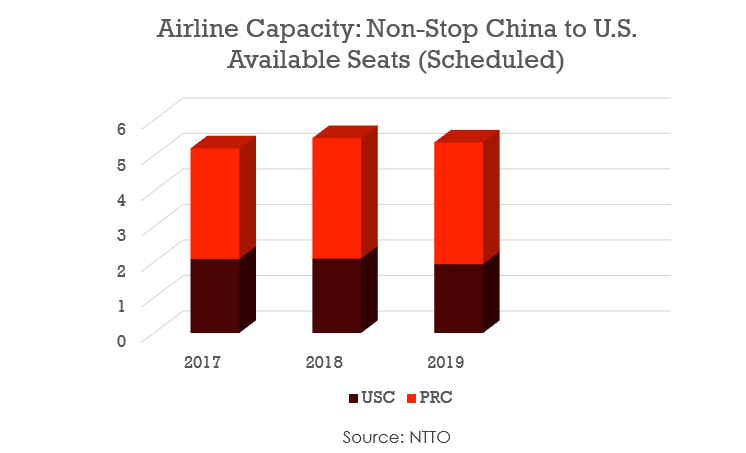
Airline capacity is one indication that the travel industry should expect a long-term positive trend from China. Before 2017, US carriers dominated the market, then it became 50/50, and now there is more capacity on the Chinese side, with a 60%, 62%, and 64% seat share for Chinese carriers from 2017-2019, respectively. Especially as Chinese carriers are more likely to take Chinese passengers, this shows that Chinese airlines are bullish about the US market. Overall capacity increased in 2018 by 5.5%, but US carriers were only up by 0.6%, with Chinese carriers up 8.8%. In 2019, overall capacity is down 2.3%, with a 7.6% drop from US carriers and a 1.1% increase from Chinese carriers.
In-Destination Behavior
Nearly 25% of all Chinese visitors to the US in 2018 visited New York City, yet JFK and Newark airports were only the port of entry for 17-18% of Chinese arrivals. Based on this and the number of top destinations, we can see that Chinese travelers are very mobile once they reach the US. In 2018, Chinese visits to Los Angeles and Texas increased, while visits to Hawaii and Washington, DC declined (TBC).
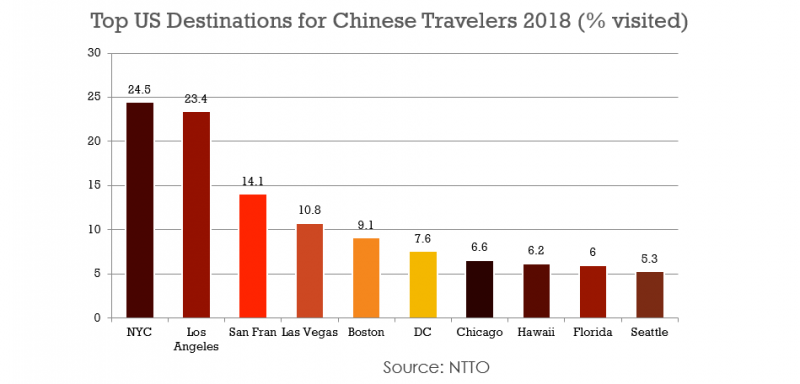
The percentage of Chinese who travel within the US by airline is significant – the overall average for international visitors is only 26%, compared to 37.9% for Chinese. The percentage taking buses is also high, and buses are especially popular for traveling on the East Coast. These numbers again show that Chinese tourists are particularly mobile once they reach the US, visiting multiple destinations on one trip.
![]()
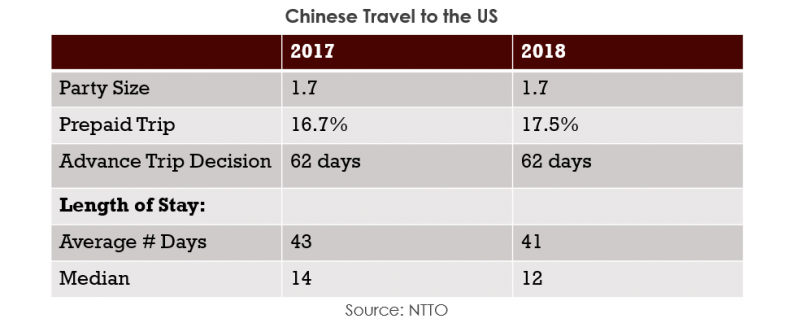
Data on the average number of days spent by Chinese arrivals in the US includes students, so the median numbers are more accurate for understanding tourists.
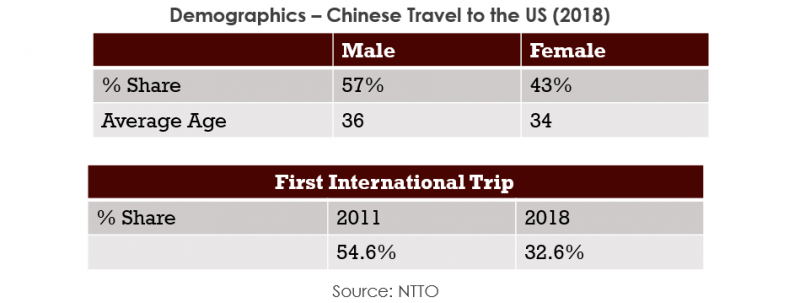
Demographics
The noticeable decline in the percentage of Chinese visitors traveling to the US as their first international trip indicates an increase in repeat visitors between 2011 and 2018.
More Information and Updates
The NTTO is a division of U.S. Department of Commerce, International Trade Administration. You can find regularly updated information on their website. The NTTO’s full 2018 Chinese market profile for travel to the US is available to download here.
The wonderful partners we work with


Sign up for our free newsletter to keep up to date on our latest news
We do not share your details with any third parties. View our privacy policy.
This website or its third party tools use cookies, which are necessary to its functioning and required to achieve the purposes illustrated in the cookie policy. If you want to know more or withdraw your consent to all or some of the cookies, please refer to the cookie policy. By closing this banner, scrolling this page, clicking a link or continuing to browse otherwise, you agree to the use of cookies.