


Executive Summary
Dragon Trail’s WeChat Rankings Report for Q1 2020 examines and analyzes the performance of six categories of travel brands on WeChat: national tourism organizations (NTOs), destination marketing organizations (DMOs, referring to regional and municipal tourism boards), airlines, cruise lines, museums and attractions, and hotels. With the coronavirus crisis erupting from China just at the start of the important Chinese New Year tourism season at the end of January, this quarter was significantly different for Chinese tourism from any we have analyzed since the start of 2017. However, despite the sudden drop in Chinese tourism, readership of tourism brands’ content actually rose for most categories and leading accounts during this period, highlighting WeChat’s importance as a communications platform.
Introduction
Since the start of 2017, Dragon Trail Interactive has tracked official accounts on WeChat for international travel brands, with weekly rankings that look at accounts based on how many total views they got for their articles published that week, as well as the total number of articles, most-viewed articles, and ‘likes’ on articles. Data is collected for six different account categories: National tourism boards (NTOs), destination marketing organizations (DMOs) for regions and municipalities, airlines, cruise lines, museums and attractions, and hotels.
This data reveals which accounts and types of posts are performing most successfully on WeChat, helping to provide an industry benchmark, and guide marketing decisions around WeChat strategies, as well as to reveal the consumer preferences of Chinese outbound tourists.
With the coronavirus crisis erupting from China just at the start of the important Chinese New Year tourism season at the end of January, and growing into a worldwide pandemic, Q1 2020 has been dramatically different from any period we have analyzed in the past. The results give us insights into how international tourism brands have chosen to respond to the crisis, and how Chinese consumers’ have continued to interact with tourism-related WeChat content.
The sudden drop off in Chinese tourism was not mirrored by Chinese engagement with tourism-related WeChat content – in fact, while most travel brands have decreased the amount of content they post on WeChat during this period, average views per article have actually risen in most categories and for many leading accounts. What this shows us is that WeChat is not just a platform where Chinese travelers engage with interesting marketing content – although they certainly do that – but it is also a resource that Chinese tourists really do turn to for information on travel, and one that they will engage with even when travel plans are postponed indefinitely.
NTOs
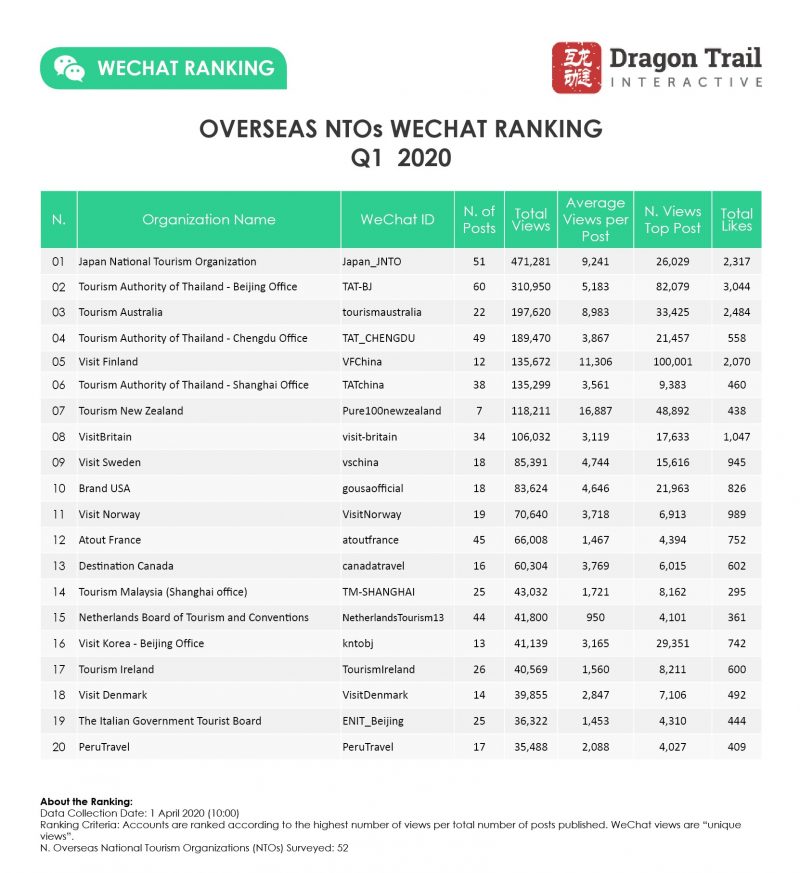
For rankings based on total views received for all published content, Japan has maintained its 1st place position for the ninth quarter in a row. Thailand also remained strong, ranking in 2nd, 4th, and 6th place. Unlike most countries, which operate just one WeChat account for their national tourism boards, the Tourism Authority of Thailand has separate accounts run by offices in Beijing, Chengdu, and Shanghai. Australia is another historically strong account, and ranked 3rd, despite posting only around half as many articles as in past quarters.
Finland, which ranked in 16th place for 2019, ranked in 5th for Q1 2020, thanks to one post that came out very quickly in response to the coronavirus crisis in China – on 26 January – advising Chinese travelers on health services available in Finland. This post got more than 100,000 views* – for comparison, Finland’s most-viewed WeChat post of 2019 got 26,481 views.
After Finland’s informational post, the most-viewed WeChat article by a national tourism board for the quarter was a pre-crisis Chinese New Year promotion from the Tourism Authority of Thailand’s Beijing office on 17 January, with a chance to win a free luxury hotel stay.
Some accounts dropped their posting moderately – for example, Japan posted 51 times in Q1 2020, compared to 68 times for the same period in 2019, a 25% drop. Australia posted only 22 times, compared to 44 times in Q1 2019. Looking at all NTO accounts on WeChat, the average number of posts per account in Q1 2020 was 19, down from 22 posts in Q1 2019, and an average of 20.5 posts per quarter in 2019.
After Chinese outbound travel restrictions went into place at the end of January, New Zealand only posted twice during the quarter – once on 3 February to announce a ban on incoming travel from mainland China, and again on 11 March with a short video of greetings from New Zealanders. New Zealand therefore dropped from 21 posts in Q1 2019, to just seven this past quarter, but maintained the highest average views per post for any NTO, which is standard for New Zealand’s account.
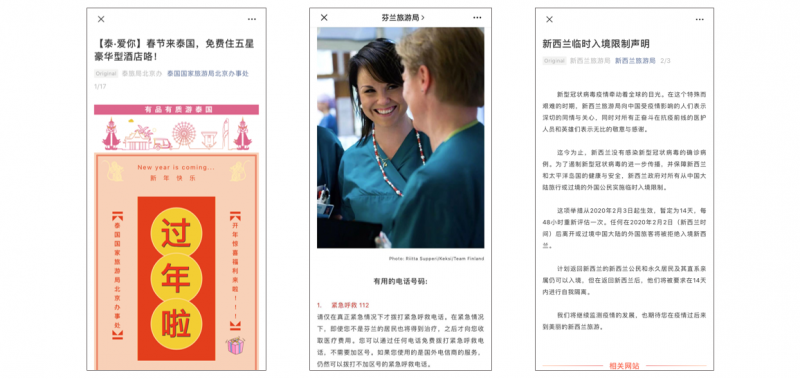
Q1 2020’s most-viewed WeChat posts by national tourism boards (left to right): A Chinese New Year giveaway from the Tourism Authority of Thailand; information on emergency contacts and health services from Visit Finland; and an announcement on a travel ban from mainland China by Tourism New Zealand
At a time of increasingly reduced outbound travel from China, readership of NTOs’ WeChat content did not see a significant decrease. The average views per post for all active NTO accounts in Q1 2020 (3,122) were actually 1.6% higher than the average views per post for all of 2019 (3,073) and only 5.8% lower than Q1 2019 (3,314). While Japan dropped from an average of 10,647 views per post in Q1 2019 to 9,241 views per post in Q1 2020 (a 15.2% decrease), Thailand’s Beijing account increased average views per post by 75.5% year on year. New Zealand’s average views per post were up by 40% compared to Q1 2019, and Australia’s increased by 62.2%.
*100,000 views is the maximum number of views counted by WeChat.
DMOs
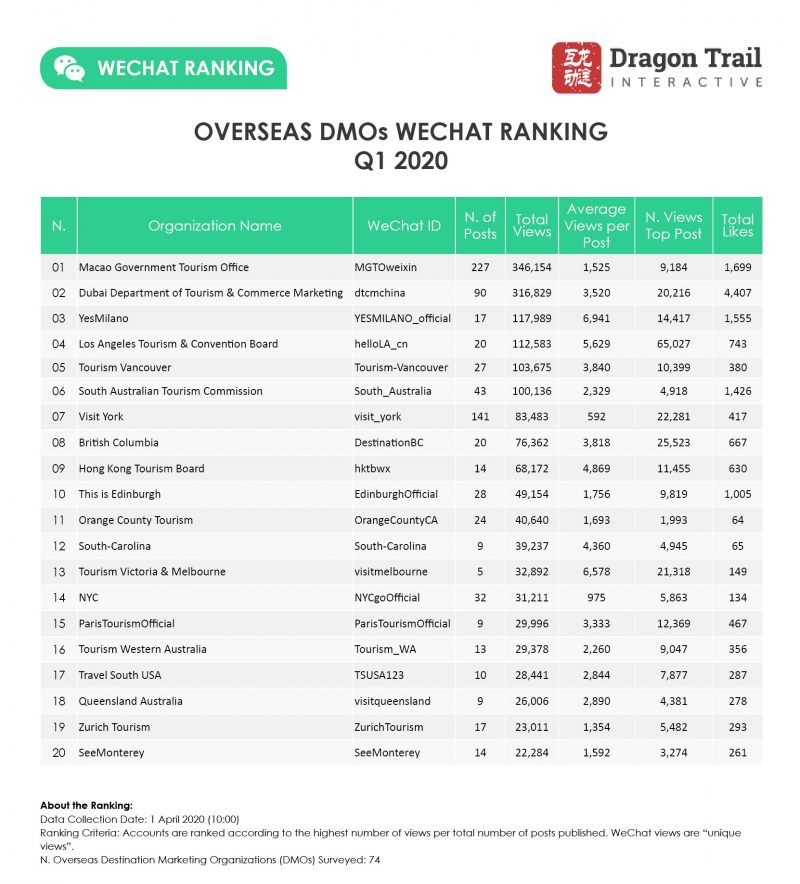
Like national tourism boards, regional and municipal tourism boards also tended to both post less and receive more views in Q1 2020. The average number of articles posted by DMO accounts was 18.7 posts for this quarter, compared to an average of 19 posts per quarter in 2019, and 21 posts for Q1 2019. Average views per post for DMOs in Q1 2020 (1,591) were 10.6% higher than for all of 2019 (1,439) and 6.3% higher than in Q1 2019 (1,497).
There are several interesting newcomers to the top of the rankings chart for DMOs this quarter – one is Milan’s tourism board, which made a strong debut on WeChat at the end of 2019. In the first quarter of this year, they increased average views per post by 75.7% compared to 2019, and ranked 3rd for total views. Milan’s early 2020 article views are much higher than late in the quarter, however, dropping from around the 20,000-view mark to less than half that by the end. There are a few reasons this could have happened: First, perhaps interest was higher as Chinese planned their travel before Chinese New Year and before the virus outbreak. Second, perhaps interest in traveling to Italy has declined as the country has become the most affected in the world by COVID-19. A third possibility, is that the account did some advertising before the crisis, which boosted views, but cut back on this once tourism was no longer a short-term possibility. That said, one aspect of Milan’s WeChat marketing stands out: short videos with both Chinese people and Mandarin-speaking Italians who live and study in Milan. This strategy taps into the popularity of short video, and adds personality and human faces to the marketing, with Chinese citizens vouching for Milan, and Italians welcoming Chinese visitors in proficient Mandarin.
Macao came out at the top of the rankings for the quarter, thanks to the sheer quantity of its content – 227 articles for the quarter, which was far higher than the DMO average, and more than double the number of articles the territory posted in Q1 2019. Macao’s average views did not benefit from this increased posting schedule, dropping by 7.5% compared to the same period last year, and 15.7% compared to 2019 as a whole.
Another newcomer to the top 10 list was the account with the second highest number of articles for the quarter: Visit York. The English city has been posting copious amounts of content since last year, but with generally very low viewership. On 25 January, however, York’s article on tracing visitors from Wuhan to the UK surpassed 22,280 views. Since then, the account has regularly posted news about coronavirus in the UK, increasing average article views from 133 in 2019, to 592 in Q1 2020, a 346% jump.
Los Angeles also had a strong quarter, thanks to coronavirus-related content, with more than 65,000 views for a post on a piece of classical music composed by L.A.-based musicians in honor of China during the crisis.
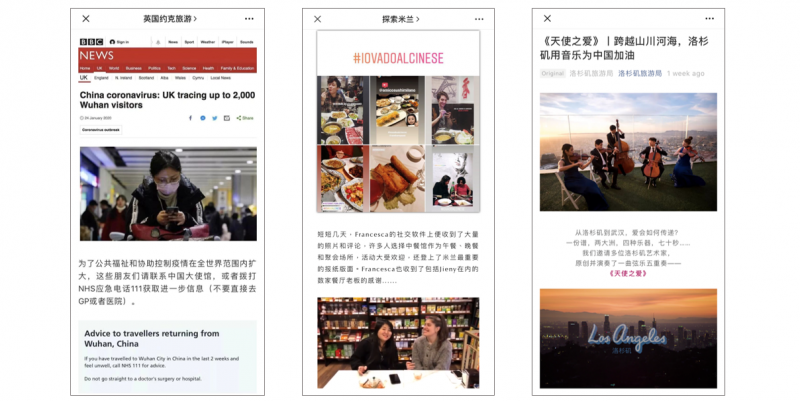 Standout WeChat content by DMOs in Q1 2020 included (left to right) Visit York’s translation of British news on the coronavirus outbreak; YesMilano’s short videos with Chinese-speaking residents; and Los Angeles’ classical music tribute to China
One less successful case worth looking at is the Hong Kong Tourism Board, which used to always dominate the WeChat Rankings, with the highest views per post, even in Q4 2019, when the account only posted twice. While most of the top WeChat accounts either increased or maintained largely similar views per post in Q1 2020 compared to the previous year, Hong Kong is no longer drawing the attention it used to. Tourism to the city had already declined considerably last year due to ongoing protests, and the WeChat numbers potentially indicate a drop in interest from the mainland tourism market. Posting 14 times in Q1 2020, Hong Kong’s average view rate (4,869) is still well above average for the DMO category, but 25% lower than in Q1 2019 (pre-protests), and 39.5% lower than the account’s 2019 average.
Airlines
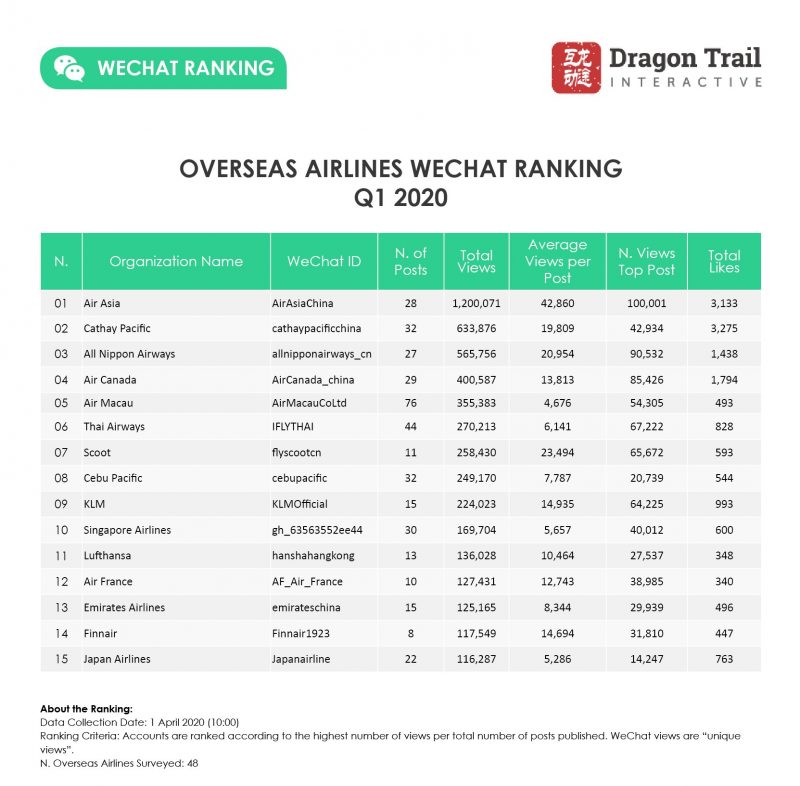
Airlines averaged 22.6 posts per quarter in 2019, and in Q1 of that year. In Q1 2020, the average posts per airline account fell to 18.2, but views per post increased significantly. This might be expected at a time with so many flight cancellations and changes, and travelers looking online for information in the midst of the crisis. The average views per post for airline content on WeChat in Q1 2020 was 39.5% higher than the 2019 average, and 47.4% higher than Q1 2019.
The leading airline accounts for the quarter – AirAsia, Cathay Pacific, and All Nippon Airways – can often be seen at the top of the WeChat rankings. Air Canada ranked in 4th for the quarter, which is the first time in nearly two years (since Finnair in Q2 2018) that a non-Asian airline has ranked in the top five for a quarter, and the highest ranking for the Canadian airline in our three years of quarterly reports. Air Canada got 85,426 views for its 26 January post on free changes to ticket bookings from mainland China, compared to just 18,478 views for its most-read article of 2019.
Cruise Lines
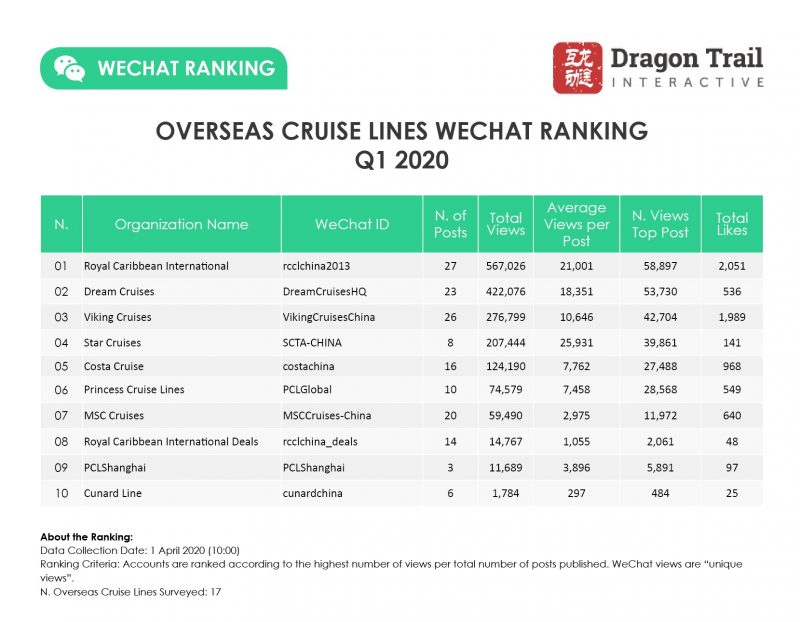
Chinese travelers may be wary of taking any international cruises at present, but they have been much more engaged with cruise lines’ content on WeChat during this crisis period. International cruise lines posted less than half as much content in Q1 2020 compared to Q1 2019 (160 articles vs. 385 articles), but the average views per post were up by 73.7%.
The top cruise line accounts were quite consistent from 2019 to the past quarter, but there are increases in the average views per post for most of these. Some of the most-viewed articles from the past quarter including Royal Caribbean’s end of January post on precautions to protect guests from coronavirus, with nearly 59,000 views; Dream Cruises’ mid-January Chinese New Year sales, with 53,730 views; and Viking Cruises’ late January announcement about waiving all cancellation fees, with 42,704 views.

Top WeChat posts by cruise lines in Q1 2020 (left to right): Dream Cruises’ interactive Chinese New Year promotion; Royal Caribbean International’s information on coronavirus-related safety measures; and Viking Cruises announcement on waived cancellation fees
It would be misleading to say that this paints an optimistic outlook for the Chinese cruise market – some of the attention is, of course, precisely because of the disastrous quarter that many cruise companies have had. Princess Cruise Lines’ 131.3% increase in average views per post in Q1 2020 compared to the whole of 2019, is undoubtedly due to interest and concern in the news regarding the Diamond Princess, where 712 of the ship’s 3,711 passengers and crew tested positive for the virus.
Museums and Attractions
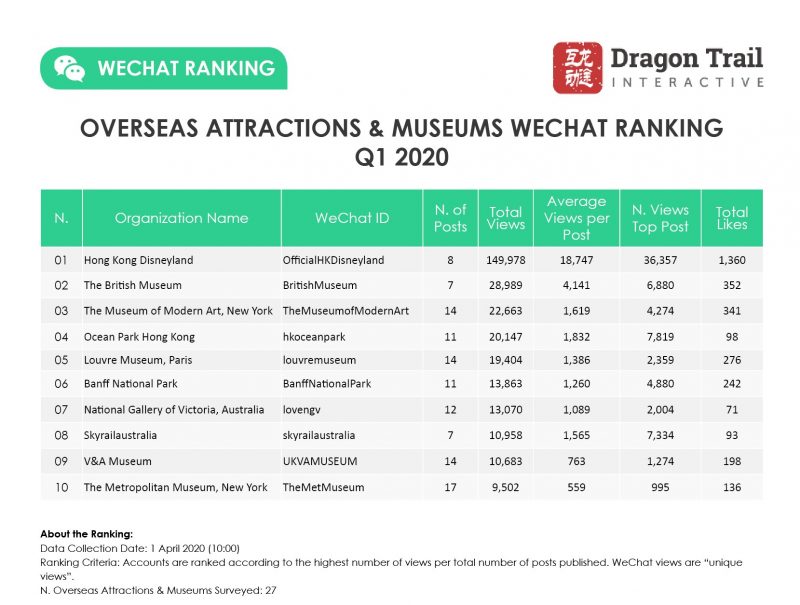
Museums and Attractions is the one category of overseas WeChat accounts where we saw a significant drop in the average number of views per post – a 28.8% decline compared to Q1 2019, and a 15% decline compared to 2019 as a whole. Accounts posted an average of 10.2 times during the quarter, down from 13.4 posts in Q1 2019, and 27.6 posts per quarter for 2019 on average.
The decline was not uniform. Buoyed by a very popular post addressing Chinese visitors to the park during the crisis, Banff National Park in Canada increased their average views per post by 42.2%. Despite closing to the public, Hong Kong Disneyland somehow beat their 2019 average by 63%. In contrast, Hong Kong’s Ocean Park received 33.8% less average views per post in Q1 2020 compared to 2019. The most popular museums saw only small drops compared to their 2019 averages: The British Museum by 7.8%, the Museum of Modern Art by 1.3%, and the Louvre by 2.9%. Chateau de Versailles dropped by 25.4%, and the Art Institute of Chicago by 14.2%.
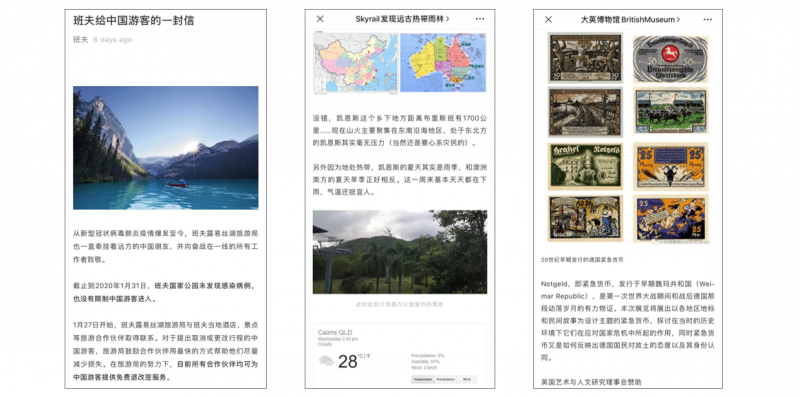
Some of the most-viewed WeChat posts by attractions in Q1 2020 include (left to right): Banff National Park’s letter to Chinese visitors; Skyrail Australia’s informational post on the bushfires; and the British Museum’s 2020 exhibition lineup
The most-viewed posts of the quarter were a mix of regular promotions and disaster-related announcements. Hong Kong Disneyland’s announcement about closing the park at the end of January got 36,357 views, and Skyrail Australia’s informational post about the Australian bushfires, during the second week of January, received 7,334 views. Meanwhile, Ocean Park’s interactive post on the “Soul of the Ocean” performance had 7,819 views, and the British Museum received 6,880 views for a January article on what the museum had planned for 2020.
Hotels
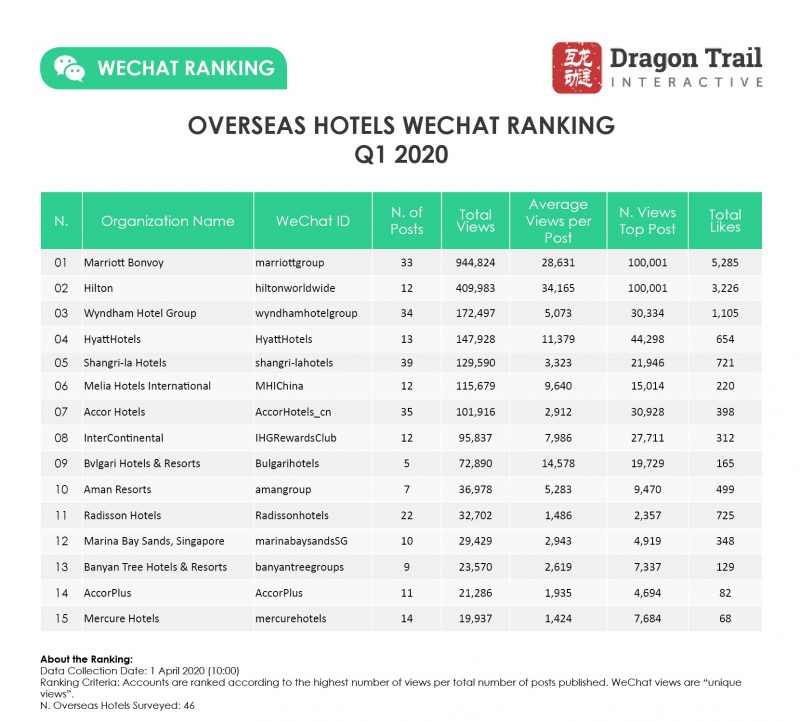
Hotels saw the highest increase in engagement from WeChat users out of any category, with an 89.5% increase in average views per post compared to Q1 2019, and a 114.6% increase compared to 2019 as a whole. Top accounts Marriott, Hilton, Wyndham, Hyatt, Shangri-la, and Melia all saw their average views and total views go up. Hotels also stand out as the only category in which tourism brands posted more in Q1 2020 than in 2019, with an average of 15.6 articles for the quarter, compared to an average of 10.1 articles per quarter in 2019.
Another thing that stands out is that in all of 2019, the most-read WeChat article by an international hotel brand got 83,315 views – in Q1 2020, both Marriott and Hilton posted articles that surpassed the 100,000-view mark. Those articles were Hilton’s end-of-January announcement that cancellation fees for bookings in Wuhan would be waived, and Marriott’s mid-February article explaining that elite status and members’ points would be extended for all of Greater China.

International hotel accounts increased their WeChat activity in Q1 2020, keeping followers informed about everything from cancellations and hygiene standards, to charity work and cooking classes
International hotels have used WeChat for a variety of communications strategies throughout the unfolding coronavirus crisis, starting with information on cancellations, and then evolving into engaging content to offer services to local residents, support guests and medical workers, and teach WeChat followers how to cook and keep fit at home. For more information on hotels’ WeChat communications during this period, please read our article on lessons from international hotels in China, or watch our April 15 webinar on what hotels around the world can do during COVID-19.
Suggestions Based on Our Findings
The increased engagement for nearly every category supports the idea that travel brands should maintain at least a minimal presence on Chinese social media platforms even when Chinese are not traveling outside of the country. This doesn’t mean that you must or should continue with the same kinds of campaigns as before the crisis – some of the most engaging content by destinations actually shifted away from normal marketing, and instead communicated to WeChat followers about what things were like in the destination, such as Visit York’s content on coronavirus in the UK, or Visit Finland’s post about emergency resources. Attracting views and establishing yourself as a trusted source of information now, can put you in a good position for attracting visitors later on.
Looking at airlines, hotels, and to some extent cruise lines, we also see how important these more service-oriented WeChat accounts have been for distributing information and communicating with travelers. Hotels stand out as a special case in their success in using WeChat during this time to grow engagement and connect with past and future guests – the fact that most of the top international hotel brands actually have properties within China makes them a different case to some extent, but establishing brand recognition, reputation, and trust, can have long-term positive effects for overseas properties as well.
The wonderful partners we work with


Sign up for our free newsletter to keep up to date on our latest news
We do not share your details with any third parties. View our privacy policy.
This website or its third party tools use cookies, which are necessary to its functioning and required to achieve the purposes illustrated in the cookie policy. If you want to know more or withdraw your consent to all or some of the cookies, please refer to the cookie policy. By closing this banner, scrolling this page, clicking a link or continuing to browse otherwise, you agree to the use of cookies.