


Dragon Trail International’s Weibo Rankings Report tracks and analyzes performance for national tourism organizations (NTOs), destination marketing organizations (DMOs), airlines, cruise lines, museums & attractions, and hotels. The report builds industry benchmarks and uncovers best practices in digital marketing in the travel sector.
Introduction
In Q2 2021, engagement rate saw an overall drop in all categories compared to the previous quarter. DMOs and NTOs are the only two categories that maintained higher levels compared to the same period in 2020, while the other categories had lower engagement than during the same period the year before.
This decline in engagement is partly due to fewer posts featuring celebrities for NTO, hotel, and airline accounts. Celebrity-endorsed content tends to drive up engagement levels for short period of time. Another phenomenon is an overall decrease in engagement. For attractions, museums, and DMOs, a short list of accounts that maintained engagement levels were not enough to make up for the overall decrease in engagement for each of these categories.
We will look at overall category performance, then review top content themes and high performing posts for specific categories.
Methodology
Engagement rate is engagement divided by follower base. Starting from the Q1 2021 report, the engagement rate has been adjusted to only count weeks when posts were published, to more accurately reflect accounts with top performing posts. This method is applied to historic data when comparing between time periods.
Our Q2 report looks at data from 175 active tourism accounts on Weibo, from 3 April until 2 June, 2021.
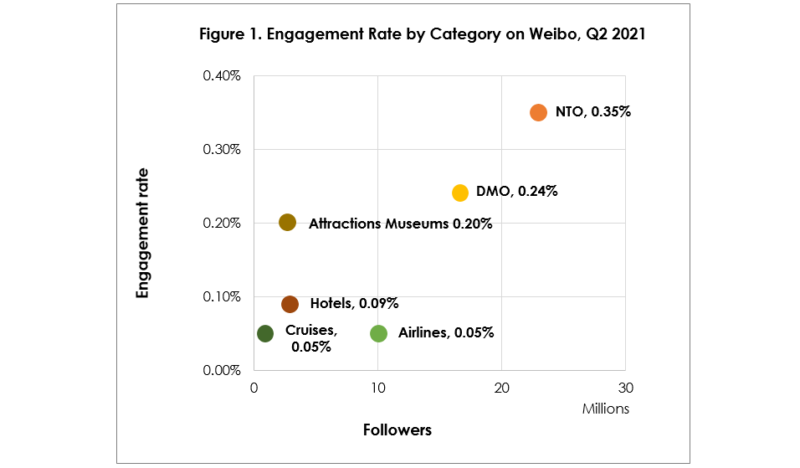
2021 Q2 Weibo Category Engagement Rate
The figure below illustrates engagement rate by category. DMOs and NTOs both have larger follower numbers, and tend to generate higher engagement overall. Airlines have relatively high follower numbers as well, but only reached the same engagement rate as cruises. On the other hand, the museums and attractions category has relatively low follower numbers, but generated a very high engagement rate with its active accounts.
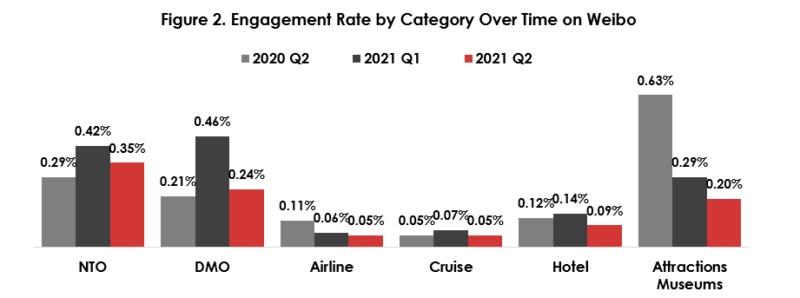
Looking at engagement rate over time, the engagement rate dropped from Q1 to Q2 for all six categories. NTO and DMO accounts kept engagement rates higher than the same period in 2020, while others dropped below or maintained the same levels from the previous year.
NTOs
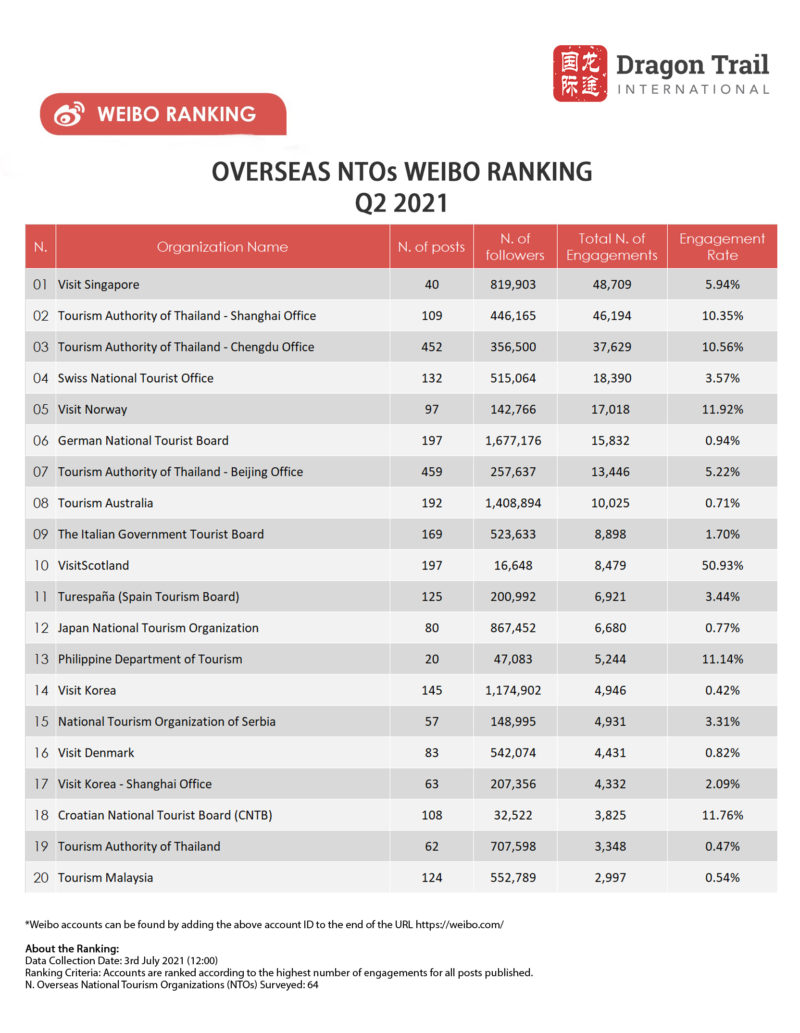
Fifty-two accounts were active in Q2 – the same as in Q1 – while the engagement rate dropped from 0.42% to 0.35%. Regardless, Q2 2021’s engagement rate is higher than the same period in 2020, signaling a stabilized performance.
Looking into account performance, Q2 saw fewer celebrity-driven engagements and online spats – both of which drove up engagement in Q1. While most accounts saw a decreased level of engagement, Tourism Authority of Thailand accounts maintained stable growth with a combination of video, images, and storyboards that portrayed a multifaceted Thailand. The top content tended to interact with followers by asking questions about Bangkok and bringing them on a relatable shopping journey.

Left: Tourism Authority of Thailand on maintaining marine biological balance. Middle: snapshot of evening images in Bangkok. Right: sharing of a storyboard on family shopping in Bangkok.
Hotels
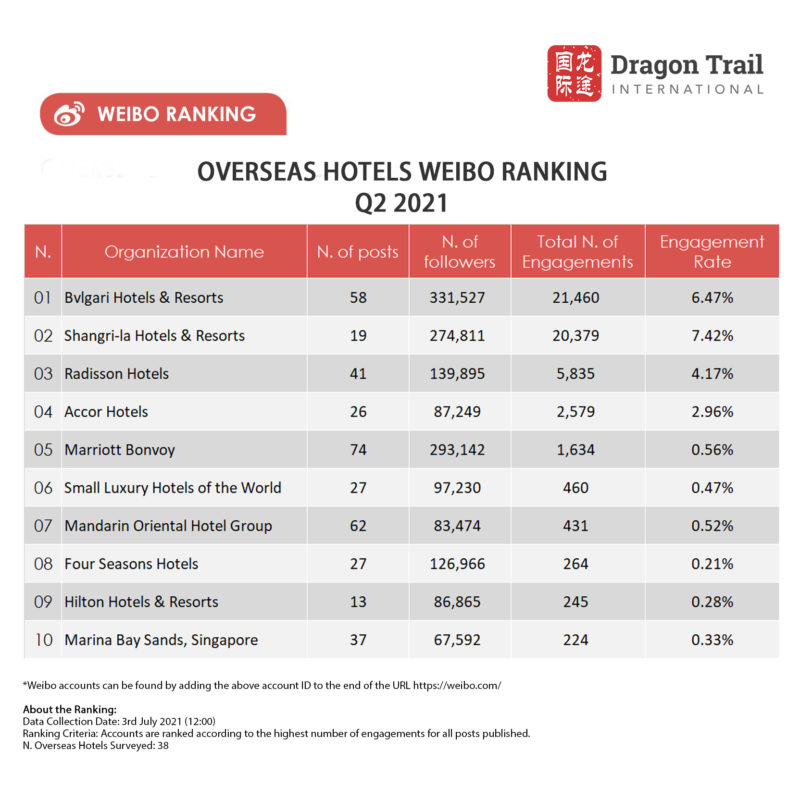
Twenty-five accounts were active in Q2, just one fewer than in Q1, while the engagement rate dropped from 0.14% to 0.09%, and below engagement rate levels for the same period in 2020.
Looking at content, Q2 saw fewer celebrity-endorsed posts than Q1, which typically drive up engagement for a short period of time.
Attractions & Museums
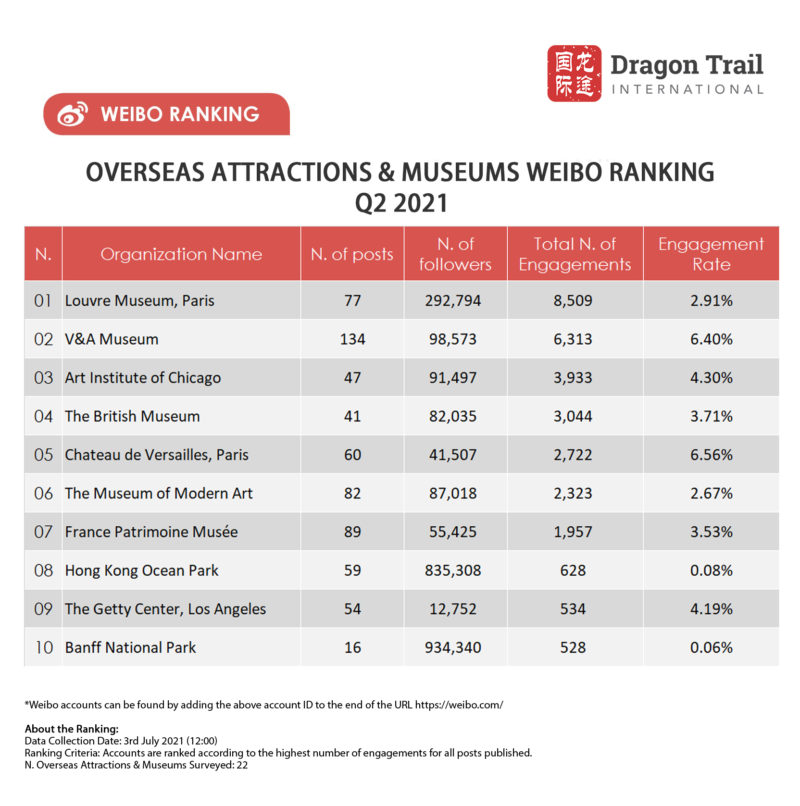
Sixteen accounts were active in Q2, up by one compared to Q1. Engagement rate dropped to 0.20% in Q2, down from 0.29% in Q1 and 0.63% in Q2 2020.
Looking into account performance, the majority of accounts saw a decrease in total engagements, with the exception of Louvre Museum and Banff National Park. The Louvre’s top posts were a combination of detailed descriptions of collection pieces, information on restoration work by museum staff, and giveaways.
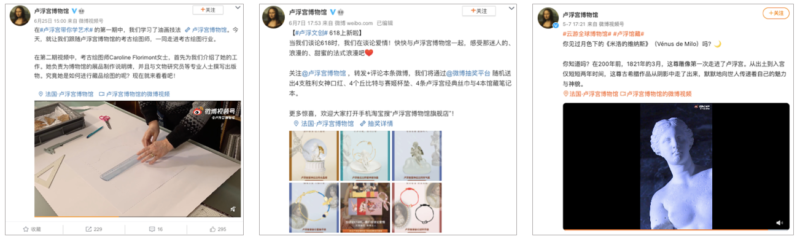 Popular posts by the Louvre Museum (left to right): A short video about the work of an archeological illustrator; a giveaway of gift shop items; and a video on the Vénus de Milo
DMOs
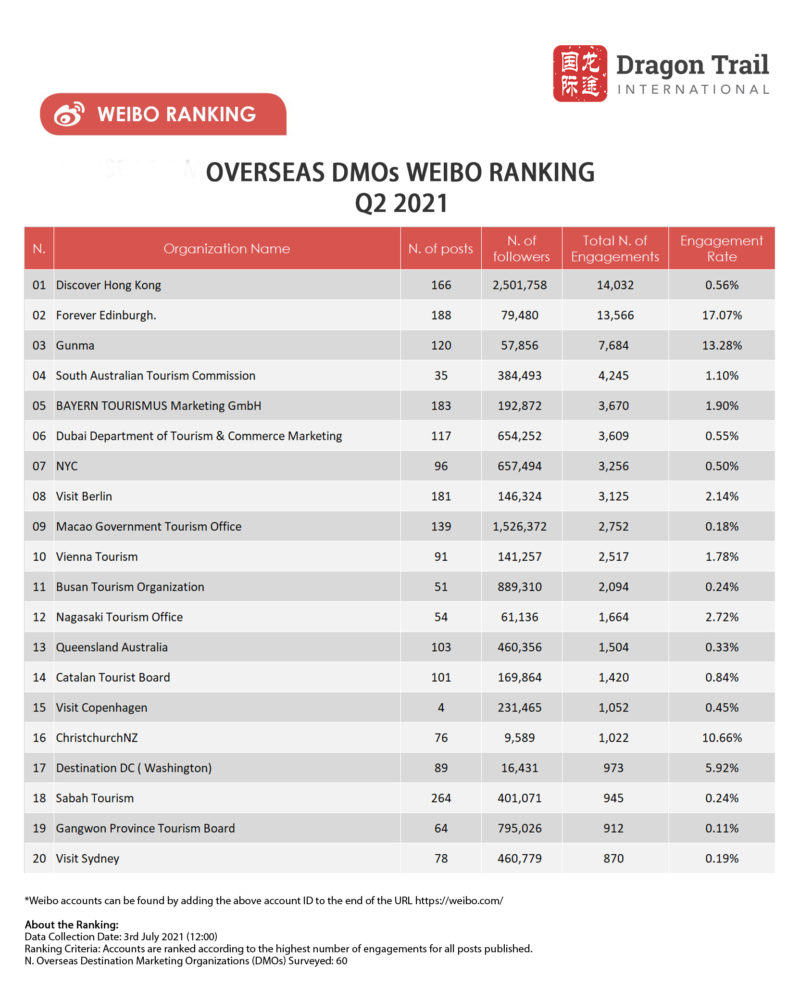
Forty-two DMO accounts were active in Q2, down by one account compared to Q1. The engagement rate dropped significantly from last quarter, from 0.46% to 0.24%, but it remained higher than the same period in 2020.
We noticed an overall decrease in engagement for the majority of DMO accounts, particularly for larger accounts.
Airlines
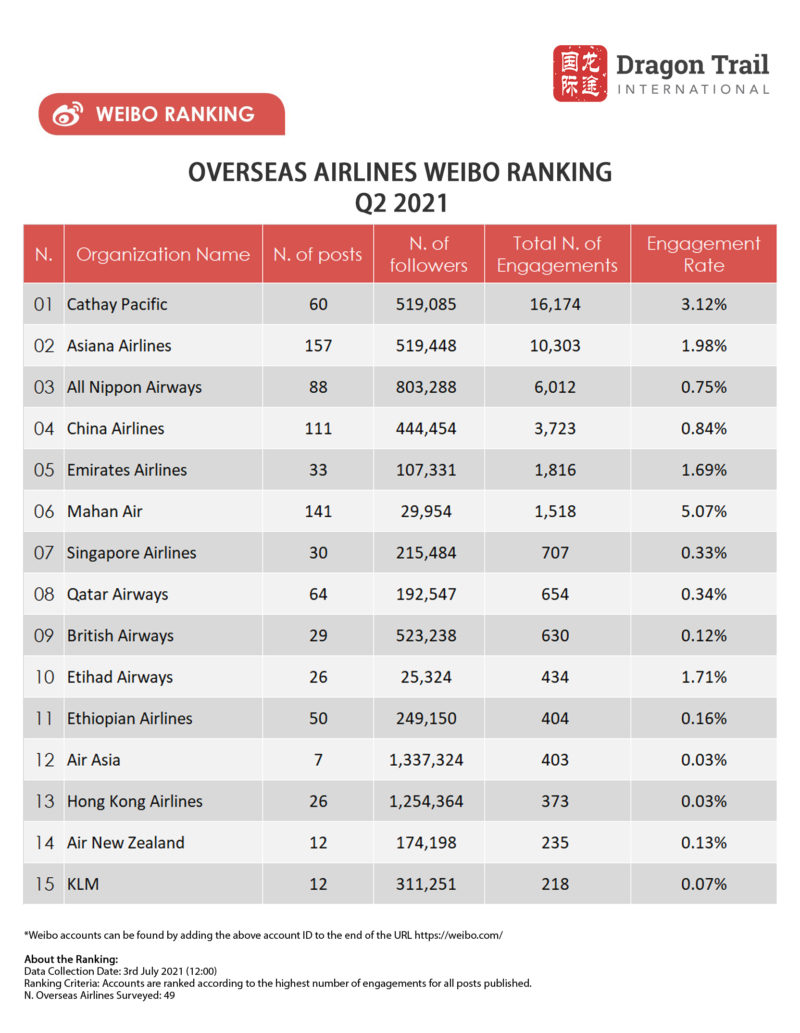
Thirty-three airline accounts were active in Q2, down by two compared to Q1. The engagement rate was 0.05%, lower than Q1’s 0.06% and Q2 2020’s 0.11%.
Q2 saw fewer celebrity-endorsed posts, which drove up engagement in Q1. The top accounts that maintained growing engagement levels in Q2 posted regularly about the resumption of flights, retirement of aircraft, or opening of airports. In Q2, flight schedules for international students traveling abroad for the fall semester also generated high engagement.
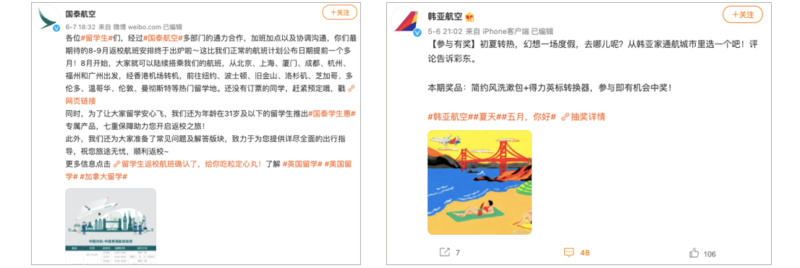
Left: Cathay Pacific’s August and September flight schedules for Chinese international students; Right: Asiana Airlines’ series of giveaways
Cruise Lines
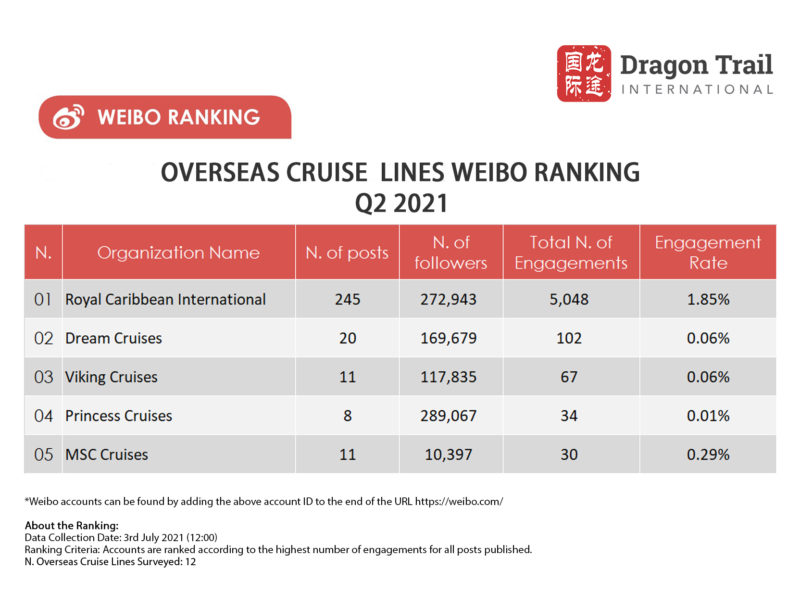
Just seven cruise accounts were active in Q2, down by two compared to Q1. The engagement rate dropped from 0.07% to 0.05% in Q1, but maintained the same level as the previous year.
Because of the small number of cruise line accounts, smaller accounts have a bigger impact on the overall engagement rate for this category. In Q1, Cunard Line generated a high engagement rate, driving up the overall engagement rate for the category, but this stabilized in Q2. On the other hand, big accounts such as Royal Caribbean International continued to engage with followers with a mix of live stream promotions and announcements about new ships.
The wonderful partners we work with


Sign up for our free newsletter to keep up to date on our latest news
We do not share your details with any third parties. View our privacy policy.
This website or its third party tools use cookies, which are necessary to its functioning and required to achieve the purposes illustrated in the cookie policy. If you want to know more or withdraw your consent to all or some of the cookies, please refer to the cookie policy. By closing this banner, scrolling this page, clicking a link or continuing to browse otherwise, you agree to the use of cookies.