


In order to objectively understand and analyze the travel industry’s use of China’s most popular social media platform, WeChat, Dragon Trail Interactive has tracked and compiled weekly data on WeChat activity by overseas tourism boards, airlines and cruise lines since the start of 2017. This information allows us for the first time to understand what kinds of strategies and content resonates best with WeChat’s 938 million monthly users. Following on our Q1 analysis of the most successful themes for travel industry WeChat posts, this report identifies the top five performing Q2 posts in four different categories, as well as the most important changes from Q1, with applicable insights and advice for travel brands on WeChat.
Account categories
There are two different ways that organizations and companies can run their WeChat accounts: One is a subscription account, which allows for daily posts. The other is a service account, which has more functions for users, but only allows a maximum of four content posts every month – companies with service accounts tend to publish a weekly newsletter with four or five different articles. Airlines and cruise lines are more likely to have service accounts, as they are more sales-driven, while National Tourism Organizations (NTOs) and Destination Marketing Organizations (DMOs) all focus on content through subscription accounts. Airlines receive the most traffic, on average, followed by cruise lines, NTOs and then DMOs.
Top 5 articles of Q2
NTOs
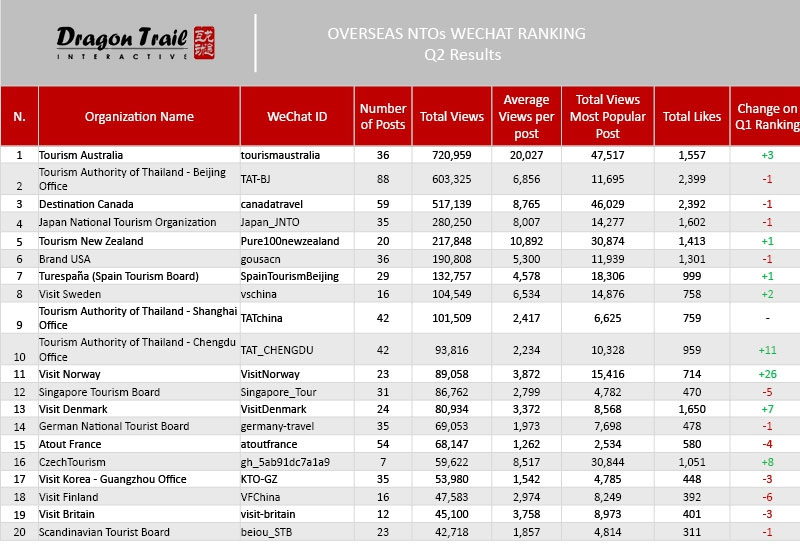
Q2 was a success story for Tourism Australia, which rose from fourth place in Q1 to first place, in terms of total article views. And with an average of 20,918 views per article, Australia’s posts got more than three times the audience than those published by the second-place account, the Tourism Authority of Thailand – Beijing Office (the Tourism Authority of Thailand has five different WeChat accounts managed by regional offices), which had an average of just 6,816 views per article.
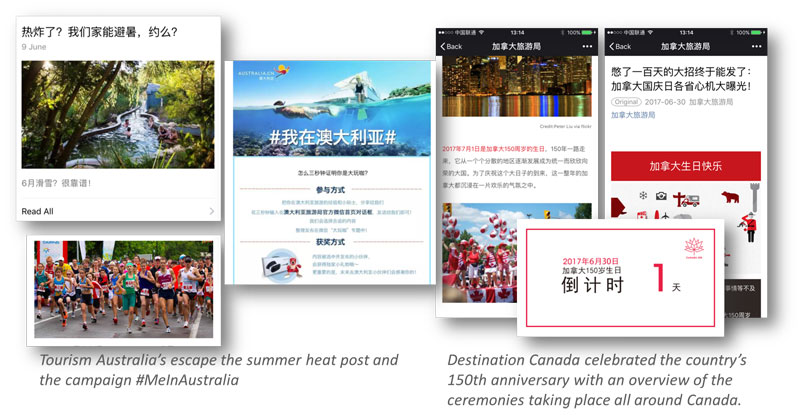
One of the ways that Australia was able to raise its profile in Q2 was by posting more – 38 articles instead of just 28 in Q1. But it still posted much less overall compared to Thailand’s Beijing account, which had 96 articles. Another way that Australia ended up increasing from 390,000 to 750,000 page views, and publishing four out of the five most popular articles in Q2, was the launch of mini campaigns every week. The NTO continued to post the photo-rich, visually pleasing articles that brought them success in Q1, but also added a call to action, asking followers to share their experiences about a weekly topic, using the #MeInAustralia hashtag, with a small prize for the winner.
The most popular article posted by an NTO in Q2 was Tourism Australia’s article the week of 5-11 June, encouraging Chinese citizens to escape China’s hot summer for winter Down Under. The article got over 47,000 total views. Tourism Australia also had the third, fourth and fifth most popular articles of the quarter. The week of 24-30 April, their article on traveling to Australia for the Chinese Labor Day holiday received over 44,000 page views. The week of 29 May-4 June, Australia got over 64,000 total post views, and its most popular article of the week introduced activities and recommended attractions to visit in the next six months throughout Australia. Finally, the week of 17-23 April, the most read article leveraged the popularity of the movie The Fate of the Furious to introduce extreme sports in Australia.
Destination Canada was the only other NTO to break into the top five articles during Q2. Their post the week of 26 June-2 July gave an overview of the ceremonies taking place all around Canada to celebrate the country’s 150th anniversary, including tips on what to do and available activities. Canada came in third place for Q2, with 565,014 total views for 63 articles – vs. Australia’s 753,025 and Thailand’s 654,307.
DMOs
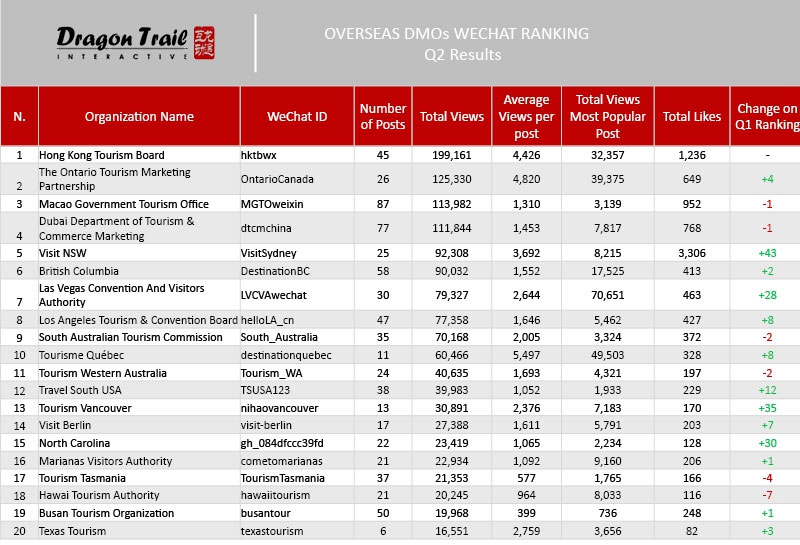
Hong Kong retained its Q1 position as the clear leader of DMO accounts in the second quarter, but there were major changes to the overall DMO list. Of all four account categories, this is the one that is most unpredictable and changeable, with several new faces in Q2 and much more movement than for other categories. It is therefore also the area with the most opportunities for new accounts, content and strategies.
Ontario rose from fifth place in Q1 to second in Q2, though they did not increase their number of posts – it was 28 in both quarters. Ontario’s total post views were just 130,520 compared to Hong Kong’s 210,339, but Hong Kong had to post 48 times to get those numbers, and the average views per post are similar for the two accounts, with 4,552 for Hong Kong and 4,162 for Ontario. In third and fourth place are Macau and Dubai. Both of these cities posted a lot – 94 times and 83 times, respectively, with average post views only around 1,500. In fifth place, Sydney got an average of 3,538 views per post, only posting 26 times in total.
A major theme for the most successful Q2 posts was celebrations. Ontario and many other Canadian accounts posted about Canada’s 150th anniversary, while Montreal celebrated its 375th birthday, and Hong Kong commemorated the 20th anniversary of the handover of the city state from Britain to China.
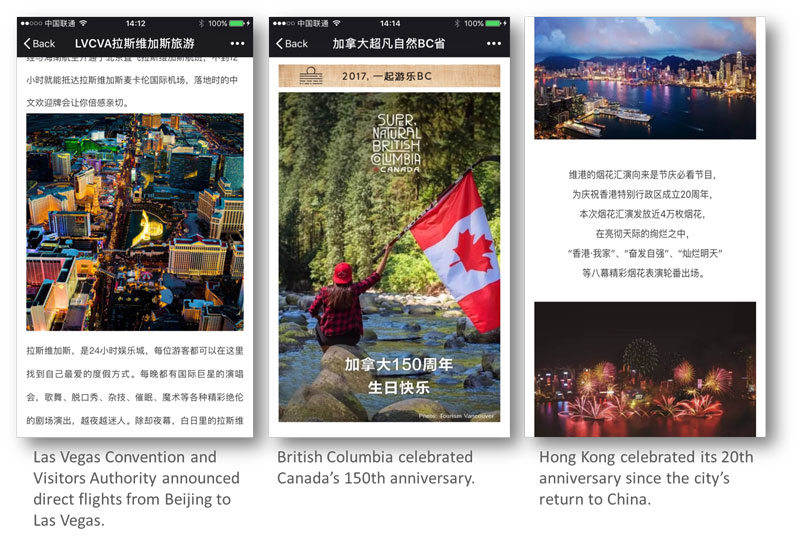
The most-viewed post of Q2, however, came from Las Vegas. The US city made it to 8th place overall, with just 10 articles, averaging 6,628 views per post. The article for the week of 26 June-2 July announcing the launch of a direct flight from Beijing to Las Vegas got an astonishing 70,651 views, compared to the second most popular article that week, with only 49,503 views.
The second-place DMO article for Q2 was posted by Tourisme Québec the week of 15-21 May. It got nearly 50,000 page views and sent Quebec to the top of the rankings for the first time since the start of the year. The post was a friendly and fun self-introduction to the city of Montreal on the occasion of its 375th birthday, with plenty of images of the city and what it has to offer.
Ontario made it to the top position for the first time this year the week of 19-25 June, when it published the week’s most-viewed article, about the celebrations planned for Canada’s 150th birthday. The following week, British Columbia had the top article, discussing the 150th anniversary celebrations in Vancouver and Victoria.
Finally, the Hong Kong Tourism Board published the quarter’s fourth most-viewed article the week of 19-25 June, a guide to the city’s celebrations for the 20th anniversary since its return to China.
Airlines
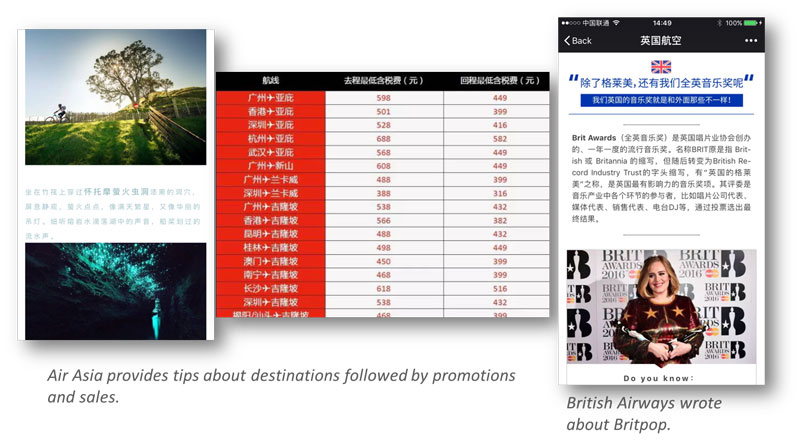
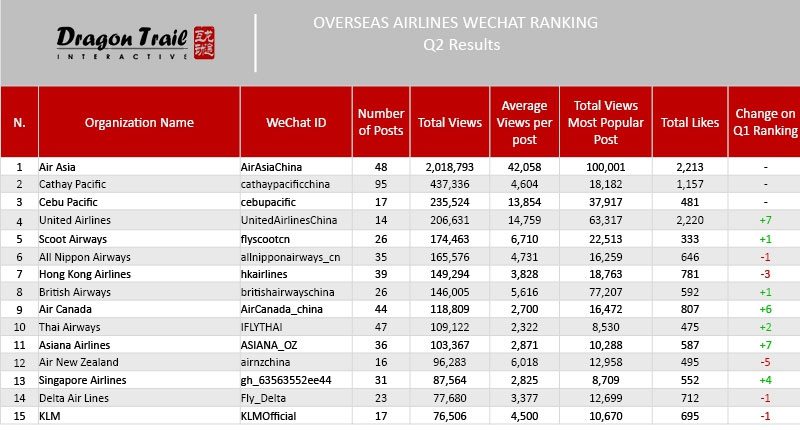
There was much less movement in the airline rankings, with Air Asia firmly entrenched in the number one spot for 11 out of the 13 weeks in Q2 (it did not publish content for the other two weeks) and far ahead of second and third place, Cathay Pacific and Cebu Pacific, both in the same positions as in Q1. Air Asia again got over 100,000 views on its most popular weekly post, with an average of 43,780 views per article, and over 2 million total views – in contrast, Cathay Pacific didn’t even reach half a million total views. Air Asia also had the top ranking article every week, but their style of articles has changed somewhat, shifting from purely hard sales to posts that provide tips about destination activities, followed by a call to action to buy discounted tickets.
Apart from Air Asia, there were other airlines whose posts performed quite well in Q2. While only in ninth place overall, British Airways twice published very successful articles. The week of 29 June-4 July, BA’s article on Britpop attracted over 77,000 post views, and the following week, the airline excelled again, with a post featuring fun facts about British culture, followed by a quiz and a campaign to win a free ticket to London. It’s worth noting that we also saw British Airways get great results for content in Q1, with its video on a long-distance relationship garnering over 50,000 views. When it comes to creative and successful content, this is an airline to watch.
United Airlines seemed to prove the saying ‘all press is good press’ in Q2, when the incident of a passenger being forcibly removed from a United flight resulted in the airline getting the highest average likes per week, at 370. Although the passenger in the incident was in fact Vietnamese, he was widely believed in China to be Chinese. United’s two messages from its CEO the week of 10-16 April apologizing for the overbooking incident, gained a combined 120,000 page views and 1,700 likes.
Posts on discounts and deals were dominant for airlines in Q1, and Cebu Pacific followed this trend in Q2, getting nearly 38,000 views for its 26 June-2 July post on RMB1 tickets to Manila.
Cruises
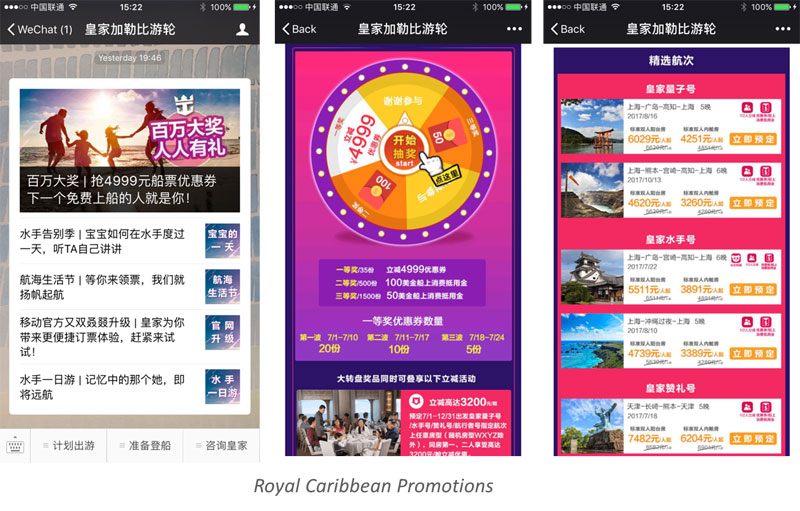
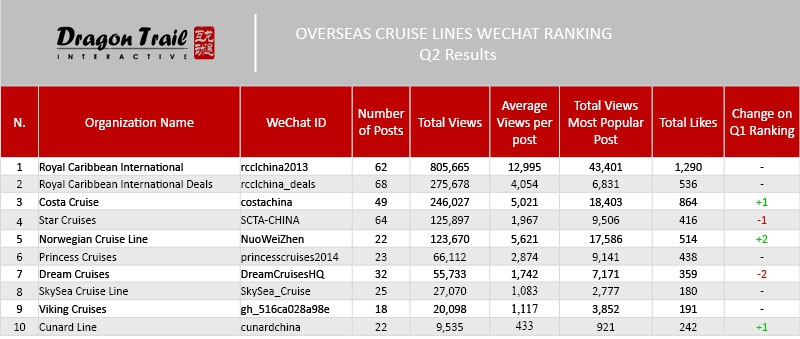
Like for airlines, the top three accounts for cruise lines remained unchanged in Q2. Royal Caribbean is by far and away the leader of the pack, with twice as many new likes every week than other cruise accounts, and 13,034 average views per post, vs. just 4,174 for second place. The second top account is Royal Caribbean International Deals, and third place is Costa Cruise. Royal Caribbean and Costa have operated in China for longer than other cruise companies, and they were also the earliest cruise lines to have a WeChat presence, so they are well established.
All top five articles for the quarter were published by Royal Caribbean International, and all five were about discounts and deals. The weeks of 5-11 June and 12-18 June were summer sales promotions, the week of 15-21 May promoted the launch of the company’s new consumer website with a buy-one-get-one-free deal, the 8-14 May was a Mother’s Day special offer, and 22-28 May again promoted summer sales, alongside the announcement of free on-board Wi-Fi.
Conclusions
Interesting, engaging content was the driving force behind successful NTO and DMO posts in Q2, with the DMO category in particular showing lots of opportunity for growth and change. A successful strategy, as evidenced by Tourism Australia, Destination Canada and Canadian DMOs, is focusing on quality over quantity, and taking advantage of events and anniversaries, while creating content that is useful, relevant, and fun to view.
Although Air Asia continues to dominate the airline rankings, we may also be seeing a shift here to more content-driven articles. British Airways again over-performed in Q2 with its interesting and cultural content, and even Air Asia is moving away from hard sales and including more diverse content, too. For cruises, however, the field remains stagnant, with posts on deals from established leaders still the firm favorites.
Methodology
Since January 2017, Dragon Trail interactive has been tracking the WeChat accounts of 43 NTOs and 53 DMOs, and publishing a list of the respective top 20 performers. For airlines, Dragon Trail has tracked 47 WeChat accounts and published the top 15 results, as well as publishing the top 10 cruise line accounts out of the 13 tracked on a weekly basis.
*Editors note: We have updated all WeChat ranking results to include all data tracked beyond the results published on a weekly basis”
Disclaimer: Dragon Trail Interactive also currently manages the WeChat accounts of Destination Canada, Los Angeles Tourism & Convention Board, Scoot Pte, Norwegian Cruise Line and Zurich Tourism.
The wonderful partners we work with


Sign up for our free newsletter to keep up to date on our latest news
We do not share your details with any third parties. View our privacy policy.
This website or its third party tools use cookies, which are necessary to its functioning and required to achieve the purposes illustrated in the cookie policy. If you want to know more or withdraw your consent to all or some of the cookies, please refer to the cookie policy. By closing this banner, scrolling this page, clicking a link or continuing to browse otherwise, you agree to the use of cookies.