


With nearly 1 billion monthly active users, Chinese social media platform WeChat has become an increasingly important digital marketing channel for reaching Chinese consumers. But with no comparative analysis of travel brands that are using this platform, it is difficult to understand which kinds of accounts and content are performing best. With this in mind, Dragon Trail Interactive began tracking WeChat posts for a weekly ranking of NTOs, DMOs, airlines and cruise lines from the start of 2017. One year later, we’ve learned a lot about the top accounts in each category, the kinds of content that resonates best with WeChat’s users, and strategic considerations that can make a huge difference.
Following up on the use of our data for Skift’s January report on WeChat strategies for travel brands, and our February webinar on 2017 for the travel industry on WeChat, here’s a more in-depth look at Q4 results for 2017, and what we have learned about WeChat for travel throughout the year.
Scroll to the end of the article for Q4 and 2017 rankings tables.
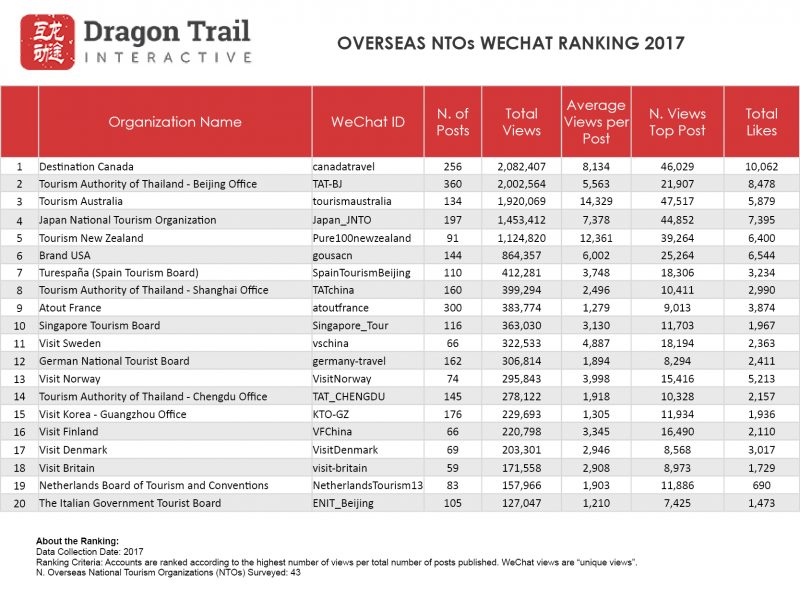
NTOs
Of all of the four categories we tracked throughout the year, National Tourism Offices had the largest pool of top players, which shifted in their rankings throughout the year. The top 5 accounts for 2017 were (in order):
1. Destination Canada
2. Tourism Authority of Thailand – Beijing Office
3. Tourism Australia
4. Japan National Tourism Office
5. Tourism New Zealand
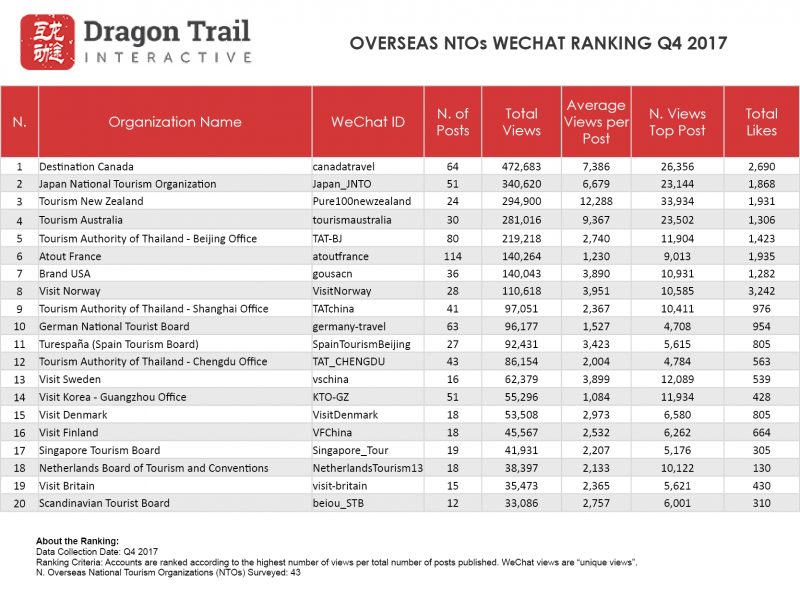
These five accounts moved around in their positioning throughout the year, with only Destination Canada making it into the top 3 accounts for each quarter, and topping the chart in both Q3 and Q4. It’s worth noting that over the course of the year, New Zealand actually ranked very high for average views per post, but tended to post much less frequently than other accounts, and so received a lower overall score for total post views. For the year as a whole, New Zealand only posted 91 times, compared to 256 posts by Canada, 360 from the Thailand’s Beijing office, 134 from Australia and 197 from Japan. But New Zealand had the second highest average for views per post, with 12,361, topped only by Australia with 14,329, and ahead of Canada in third place, which got just 8,134 average views per post. Had New Zealand posted more frequently, they would have easily been a contender for the top NTO account of the year.
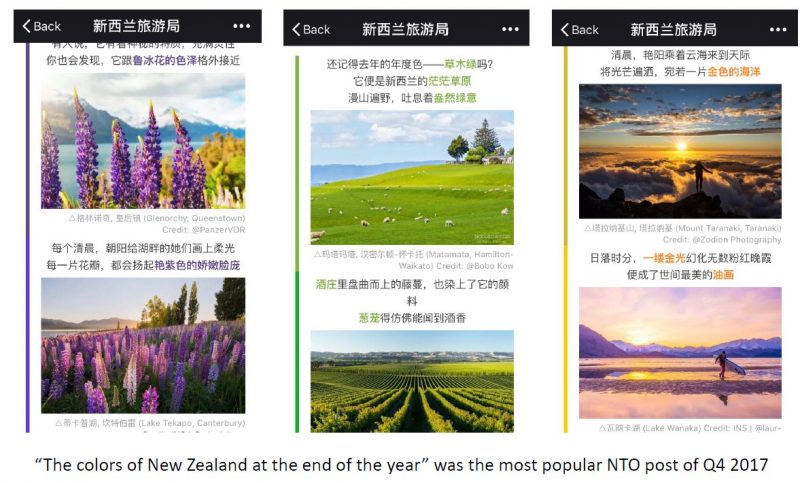 The top NTO post of Q4 2017 was an article called ‘The colors of New Zealand at the end of the year’, which got 33,934 views by 17th December. As of February 2018, this has risen to 38,495 views. The post takes viewers on a rainbow-colored tour of New Zealand, from purple flowers and green hills, to blue skies and orange sunsets. In this way, the article very much follows the trend we’ve seen all year of posts with beautiful nature photography doing the best on WeChat. The other top posts of the year include “Escape summer for winter Down Under” by Tourism Australia, celebrations for Canada’s 150th birthday by Destination Canada, and a guide to viewing cherry blossoms in Japan. See our list of the top 5 NTO posts of 2017 here.
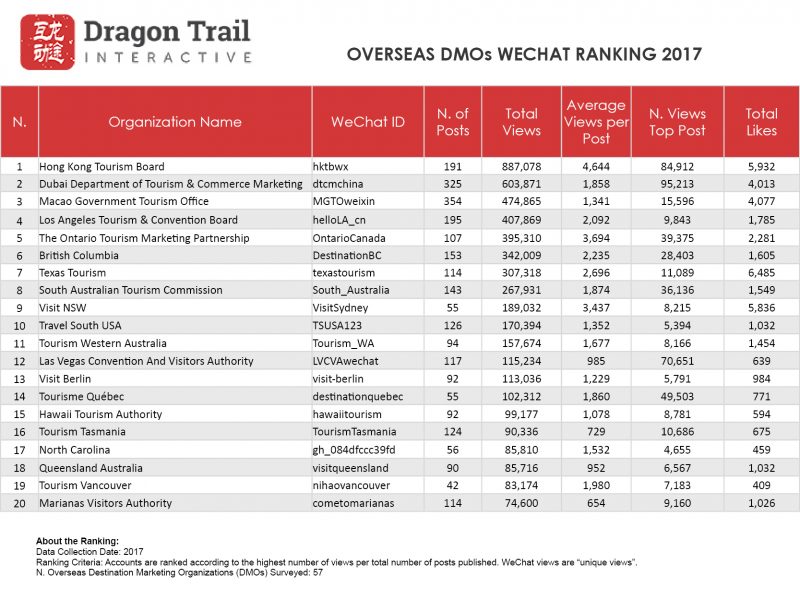
DMOs
Throughout 2017, the competition for top DMO account on WeChat was mostly among Hong Kong, Dubai and Macao, though a few other accounts managed to break into the top 3 over the course of the year: the Los Angeles Tourism and Convention Bureau, The Ontario Tourism Marketing Partnership, and Texas Tourism.
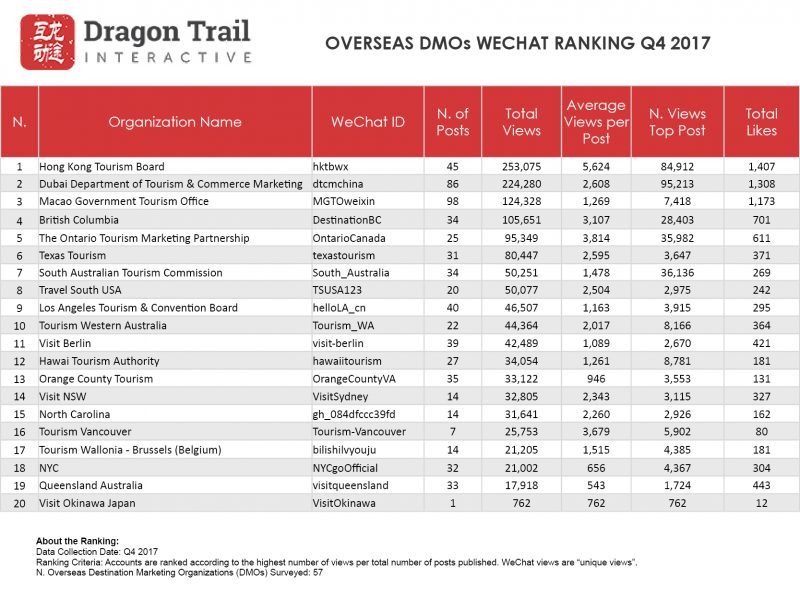
Hong Kong enjoys a strong advantage in that it is such an important destination for Chinese outbound tourists, who generally visit the city as independent travelers, and are therefore more likely to use WeChat to guide their experience. Hong Kong’s tourism board regularly publishes themed guides on WeChat that have been quite successful, such as ‘Hong Kong with children’ or a guide to Hong Kong street art or restaurants. Because of this, they didn’t need to post nearly as much as other accounts did to get the highest average viewership. To put that quantitatively, Hong Kong only published 191 times in 2017, compared to 325 posts by Dubai and 354 from Macao. But in terms of average views per post, Hong Kong topped the list at 4,644, with Dubai and Macao at just 1,858 and 1,341, respectively. That said, Hong Kong was ranked third behind Macao and Dubai for most number of posts from any DMO, tied with Tahiti – which received an average of only 296 views per post, just over 6% of Hong Kong’s average.
We might measure success of a WeChat account not just by the total number of views, but by the average views per post, which indicates how popular the account’s general content is. If we look at 2017 this way, we would rank the accounts as follows:
Average views per post, 2017:
1. Hong Kong: 5,624
2. Melbourne: 4,604
3. Ontario: 3,814
4. Vancouver: 3,679
5. British Columbia: 3,107
 The top two most viewed Q4 posts by DMOs were both published the week of 27 November- 2 December. Dubai leveraged the social media power of Chinese celebrities and got over 95,000 views for its invitation letter from celebrities A Sa and Joey Yung to visit Dubai for New Year’s Eve. Meanwhile, Hong Kong was close behind, with just under 85,000 views for its post on romantic experiences in Hong Kong for the month of December. In the last week of the year, The Ontario Tourism Marketing Partnership received nearly 36,000 views for its post about Niagara Falls in winter, with stunning photos of the frozen waterfall putting it in third place for most-viewed DMO post of Q4.
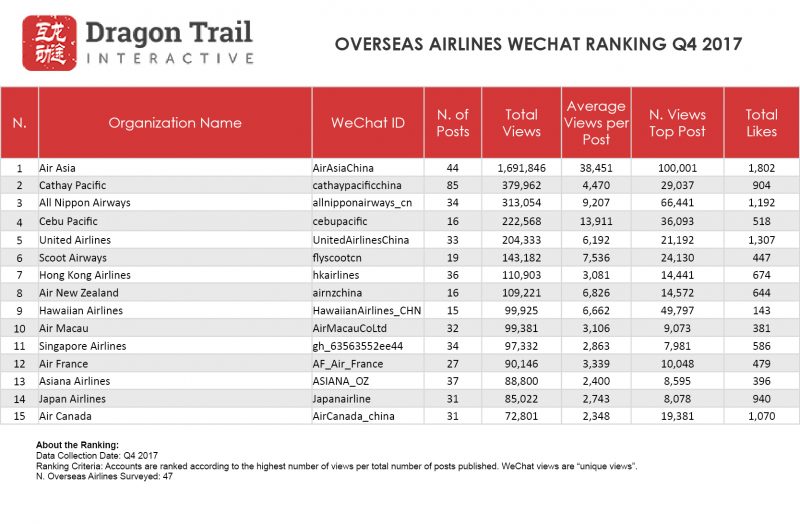
Airlines
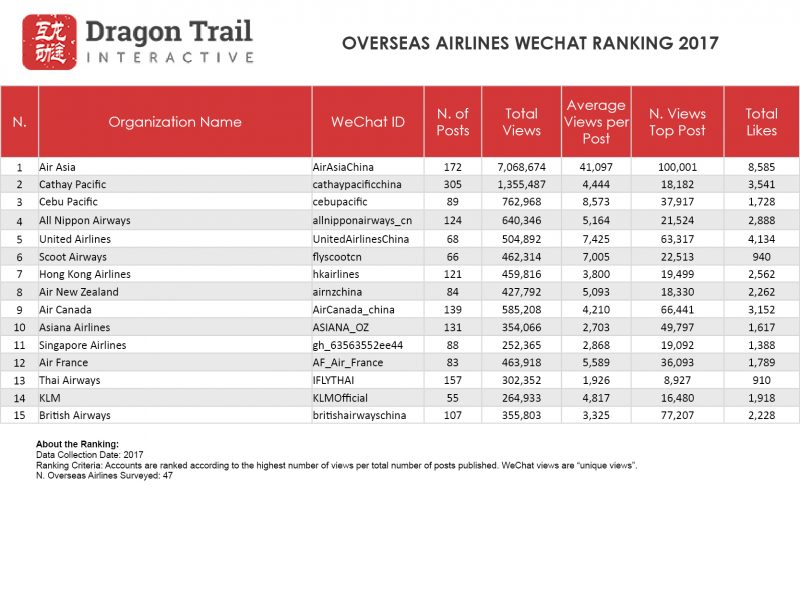
There is one clear champion of the airline category – or any travel brand – on WeChat, and this is Air Asia. In 2017, the account got over 7 million total views, and an average of 41,097 views per post. Compare this to the second most popular airline account, Cathay Pacific. They got less than 1.4 million views in total, with an average of only 4,444 views. The second most popular account in terms of average post views is Cebu Pacific, which is still very far behind Air Asia, with an average viewership of 8,583.

Every single quarter of 2017, with the exception of Q4, the quarterly rankings were the same, with Air Asia in first place, Cathay Pacific in second, and Cebu Pacific in third. The only change came in the last quarter, when All Nippon Airlines – which had been climbing the rankings slowly but surely all year – came in third. Their strategy is not unlike other airlines, with most posts about discounted tickets to Japan – one of the top destinations for Chinese outbound tourism, including promotions on flights from 2nd tier Chinese cities like Shenyang and Qingdao.
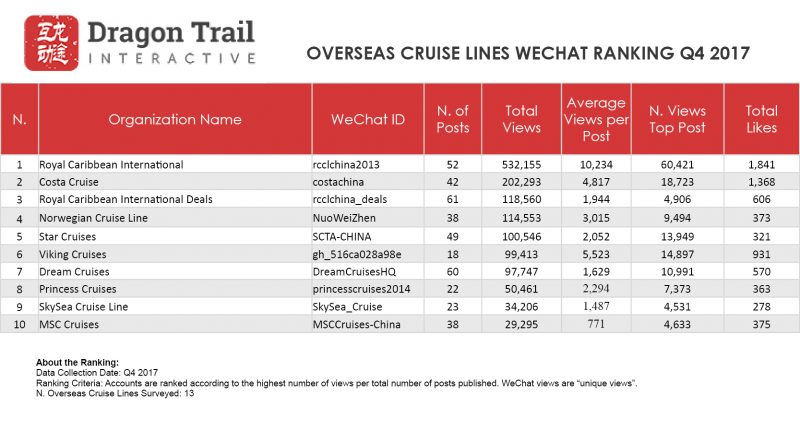
Cruises
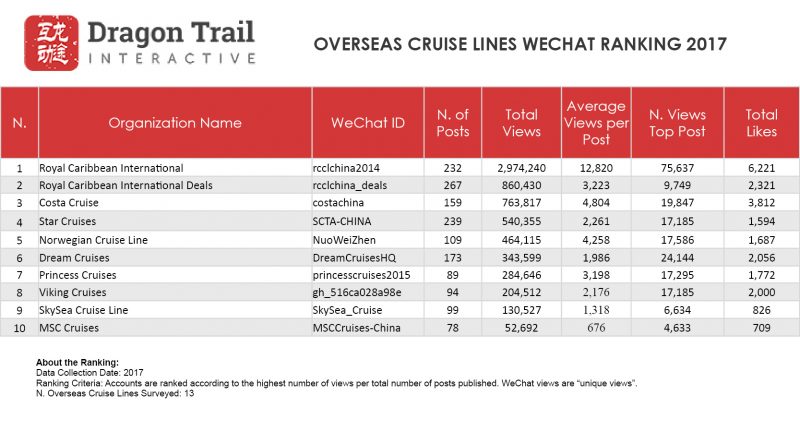
Cruises were a very stable category in 2017, with Royal Caribbean in the lead for every quarter, and few changes for second and third place. At the end of the year, Royal Caribbean had nearly 2 million total page views, with an average of 12,820 views per post. In second place was Royal Caribbean’s Deals account, which often posted the same or similar content – here, the average number of views was only 3,224, with a total of 860,430 for the year. Costa Cruises came in third, with a slightly better average of 4,804 views per post, and a total viewership of 763,817.
For Q4, the Royal Caribbean Deals account came in third place, after being in second for the first three quarters of the year, and got just 1,944 average views per post. This may be because the main Royal Caribbean account was getting more viewers and sometimes posting the exact same articles.
As in the case of DMOs, looking at the accounts in terms of average views per post can offer us a new way of looking at the accounts and the success of their content. We noticed some fluctuation in views per post for cruise lines already in Q3 (link to Q3 ranking report), and in Q4, the second strongest account in terms of average views per post was Viking Cruises, which specializes in European river cruises. They had a bit over half of Royal Caribbean’s average, with 5,523 average views, followed by Costa Cruises with 4,817 and Norwegian Cruise Line with 3,013.
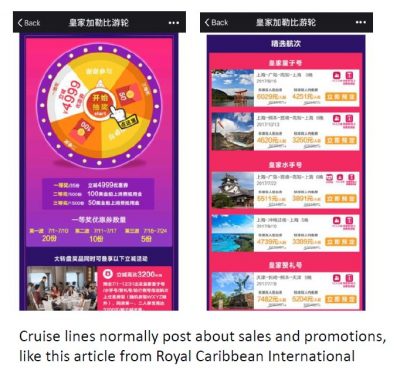
The top cruise line post of Q4 was a sales campaign from Royal Caribbean International, which was published during the first week of October – one of China’s ‘Golden Week’ holiday periods – and got over 60,000 views. Although this and most other cruise line WeChat posts are sales promotions, with the occasional article about itineraries or facilities, by far the most viewed cruise line post of the year was more political in nature. In March, 2017, Royal Caribbean got over 75,000 views for its announcement about cutting South Korea from its itineraries, to stay in line with official Chinese policy banning group tours and cruises to South Korea as retaliation for South Korea’s deployment of the US defense system, THAAD.
Q4 Rankings
2017 Rankings
The wonderful partners we work with


Sign up for our free newsletter to keep up to date on our latest news
We do not share your details with any third parties. View our privacy policy.
This website or its third party tools use cookies, which are necessary to its functioning and required to achieve the purposes illustrated in the cookie policy. If you want to know more or withdraw your consent to all or some of the cookies, please refer to the cookie policy. By closing this banner, scrolling this page, clicking a link or continuing to browse otherwise, you agree to the use of cookies.