


Executive Summary
Dragon Trail’s full-year WeChat Rankings report for 2018 looks at articles published on WeChat by the official accounts of national tourism boards (NTOs), destination marketing organizations (DMOs), airlines, cruise lines, museums & attractions, and hotels, with accounts in each category ranked by their total article views. Although the top five accounts for NTOs, DMOs, and airlines remained similar or unchanged from 2017 to 2018, the order of the rankings did see some shifts, with Visit Japan, Tourism Vancouver, All Nippon Airways, and Viking Cruises making some of the most significant gains. The national tourism boards with the highest-ranking accounts tended to be established destinations in Asia, Europe and North America, whereas Greater China, North America and Australia dominated the rankings for regional and municipal destinations. Asian airlines also far outperformed non-Asian ones. The rankings for cruise lines saw some major disruption in 2018, with particularly noteworthy performance from Viking Cruises. Museums & attractions and hotels are two new categories that have only been tracked since Q2 2018, the other categories having been tracked since Q1 2017. In the former, Hong Kong theme parks lead the way, but well known French museums, the National Gallery of Victoria, and the British Museum also got top results. International hotel accounts are dominated by the biggest global chains and differ from other categories in their focus on domestic rather than outbound travel. Looking at average article views on WeChat for travel brands, reading rates have generally increased or stayed stable in 2018 compared to the previous year, with national tourism boards the only category to see a decline – and this is heavily influenced by a decline in article views for a few top accounts, which may be balanced out by strong performance from regional tourism boards in the majority of those same countries.
Introduction
For two years, Dragon Trail Interactive has tracked official accounts on WeChat for international travel brands, with weekly rankings that look at accounts based on how many total views they got for their articles published that week, as well as the total number of articles, most-viewed articles, and ‘likes’ on articles. We now have two years of data on national tourism boards (NTOs), destination marketing organizations (DMOs) for regions and municipalities, airlines, and cruise lines. From the end of March 2018, we have also tracked two new categories: museums and attractions, and hotels.
This data reveals which accounts and types of posts are performing most successfully on WeChat, helping to provide an industry benchmark, and guide marketing decisions around WeChat strategies, as well as to reveal consumer trends of Chinese outbound tourists. Our 2018 report looks at how travel brands’ official accounts are performing overall, as well as within each category, and some of the biggest developments and learnings from the past year.
Please scroll to the end of the report for Q4-specific data.
Readership Rates
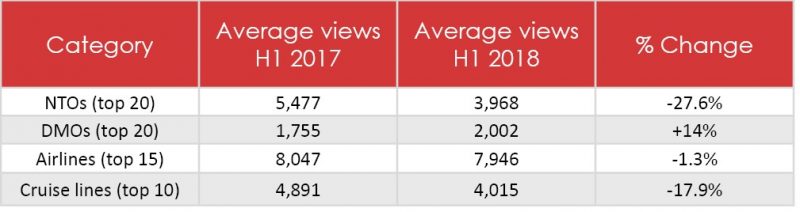
Readership rates for all official accounts (not just travel-related) on WeChat have been falling, and comparing H1 data from 2017 with the same period in 2018, it looked like travel accounts were also following this trend.
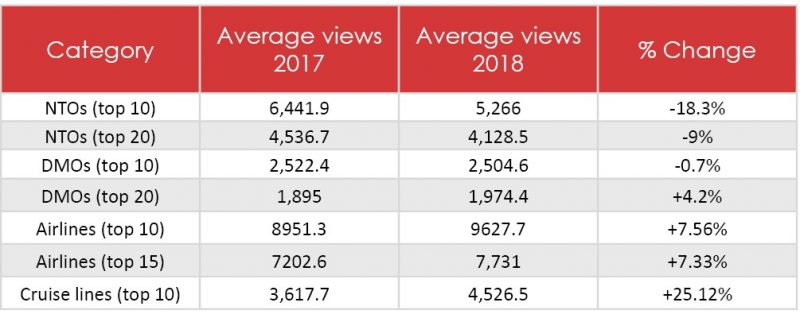
However, comparing the full year of WeChat data from 2017 with 2018 shows a more optimistic picture for user engagement with WeChat travel accounts. The drop in readership for articles published by national tourism boards is less dramatic than it was in the first half of the year, DMOs are stable, and airlines and cruise lines have both seen significant increases in the average views per post.
For consistency, we have compared the average views of the top 10 accounts in each category, as well as the average views in the top 20 NTOs and DMOs, and the top 15 airlines, to reflect the number of data published each week in Dragon Trail’s WeChat Rankings. For destinations – national, regional and municipal – the results are better with a larger sample size, indicating that the average readership for some of the top accounts may have fallen in the past year, but the outlook is more positive when we look at the bigger picture.
These findings indicate that WeChat users are continuing to engage with articles published by official accounts in the travel sector, and in some areas even engaging more frequently than in 2017. December 2018 changes to WeChat that have transformed the ‘like’ button, which had no real function, into a ‘good looking’ button that shares the article with your friends, could potentially help to improve these numbers even further in 2019.
NTOs
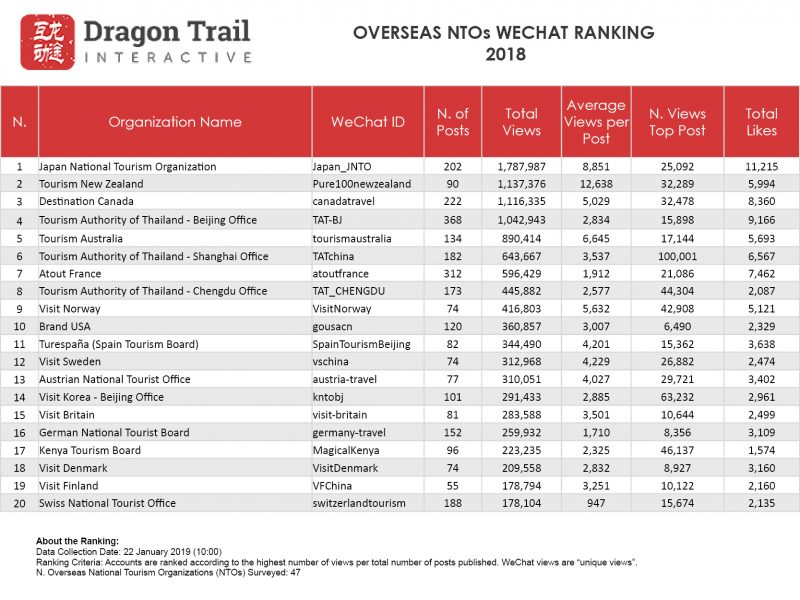
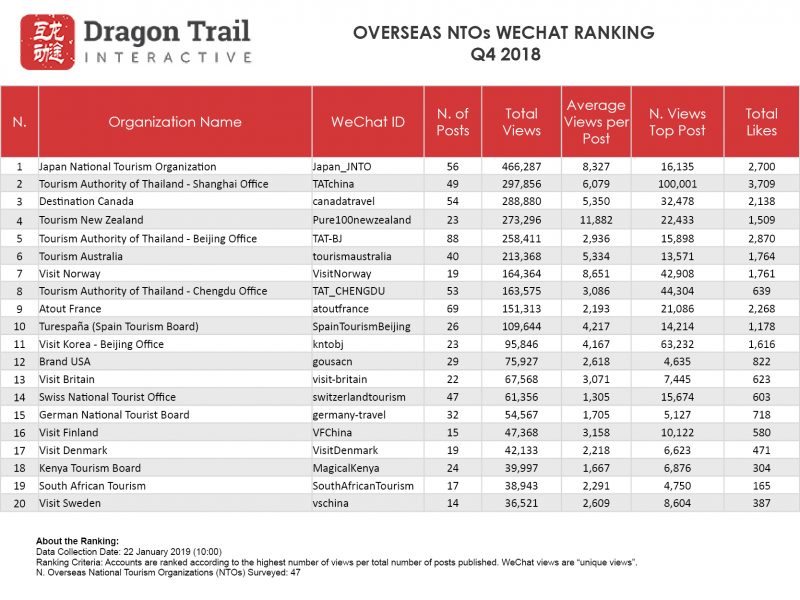
The top five NTO WeChat accounts in 2018 were the same five that topped the list in 2017, but the order has completely changed, with Canada, Thailand (Beijing Office)*, and Australia each dropping down two spots, and last year’s 4th and 5th place Japan and New Zealand in 1st and 2nd place, respectively.
As mentioned earlier, the top-ranking NTO accounts showed the largest decline in readership in 2018, with Australia’s average article views falling by 53.6%, Thailand (Beijing Office) by 49%, and Canada by 38% compared to the results from the previous year. New Zealand remained steady with a 2.2% increase, and the highest average article views for any NTO in 2018, and Japan had excellent results, with a 15.9% increase in average article views. Ranked in 6th place in 2017 and falling to 10th in 2018 is the USA, which also had only half (3,007) the average views as it did in 2017 (6,002).
Of course, decreased average article views on WeChat does not necessarily correlate to a decline in tourism, and both Australia and Canada had record years for Chinese tourism arrivals. The numbers here merely reveal attention to WeChat articles, and may indicate that Chinese consumers are looking elsewhere for travel information.
*The Tourism Authority of Thailand runs three separate official accounts on WeChat from their Beijing, Shanghai and Chengdu offices.
Success stories
The big winner for the year is Japan, which grew its Chinese tourist arrivals by 8.8% in 2018, and came in first place every quarter and nearly every week in the WeChat Rankings. Their WeChat strategy included lots of posts on food and flowers – especially in the springtime – as well as area guides, accommodation recommendations, and several posts each on hot springs and maple leaves.
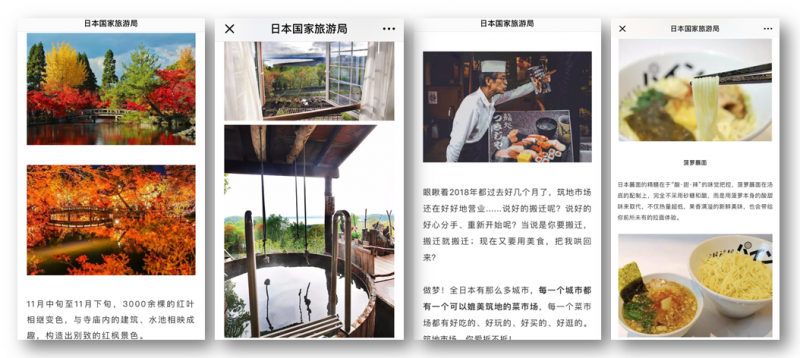 Focusing on food, natural beauty, area guides and hot springs, Japan was the top NTO on WeChat in 2018
Another rising star in 2018 was Norway, which ranked 9th in 2018, up from 13th in 2017, and saw a 40.9% increase in average post views. Norway has certainly ramped up its China marketing recently, with its king and queen visiting China in October, the same week the first-ever direct flight between China and Norway was announced. The flights will launch later this year, and Norway has already topped the WeChat Rankings once so far in 2019.
World destinations
Although Chinese travelers are increasingly visiting less traditional areas such as Eastern Europe, Africa, and South America, this is not yet reflected in the WeChat Rankings – perhaps because these destinations still remain quite niche. Especially in the case of Africa and South America, Chinese travelers are more likely to visit as part of a package tour and so might do less research on WeChat. In both 2017 and 2018, the top 20 accounts were dominated by European and then Asian destinations, as well as Oceania and North America. In 2018, however, Kenya did reach 17th place, the only African country to make it to the top 20.
DMOs
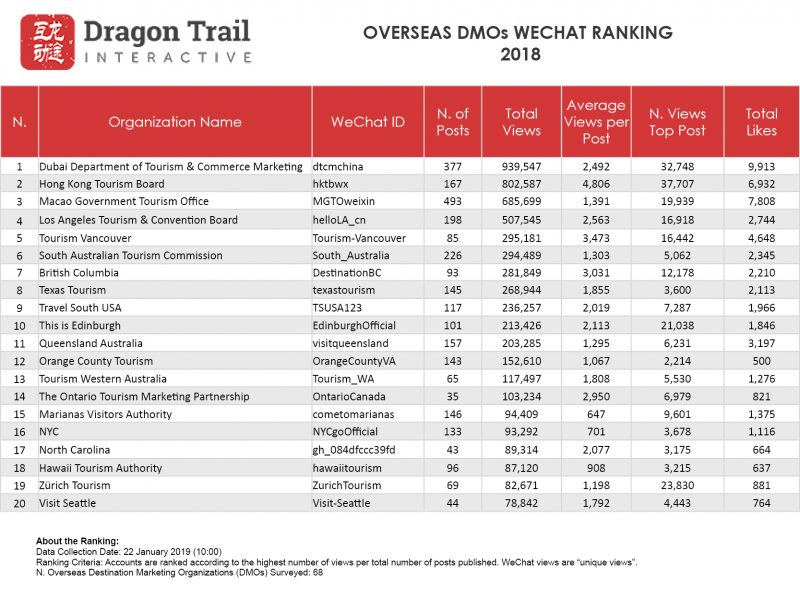
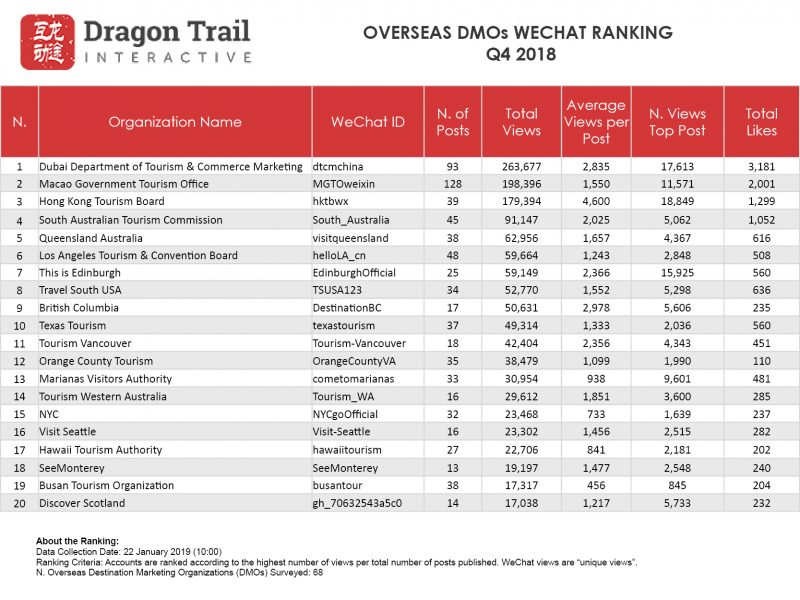
The top four DMO accounts for 2018 are the same as in 2017, with the only change in rankings the fact that Dubai and Hong Kong have switched places, with Dubai in 1st place for 2018. Unlike for NTOs, all of the top-ranking DMOs saw increases in the average views per article in 2018, with Dubai up by 34.1%; Hong Kong by 3.5%; Macau by 3.7%; and Los Angeles by 22.5%. In 5th place, though, we see a major disruption. In 2017, Ontario came in 5th, but in 2018, the account fell to 9th place in Q1, 13th in Q2, and stopped posting altogether at the beginning of May, leaving it in 14th place for the year. Vancouver, on the other hand, surged ahead from 20th place in 2017 to 5th in 2018, with a 75% year-on-year increase in average page views.
Success stories
The top four accounts maintained largely the same strategies in 2018 from 2017: Dubai was especially successful in using celebrities, from Chinese actors to Korean boy bands to President Xi Jinping himself, to attract views. Hong Kong had a more varied approach, mixing neighborhood guides and cultural activities with celebrity endorsements and dining recommendations. Macau ran a successful restaurant recommendation guide throughout the year, and, similar to Hong Kong, Los Angeles published a diverse array of content on local cultural attractions, dining, neighborhood guides and practical information.
What did Vancouver do in 2018 to attract so many views on WeChat? Their content strategy hits on many of the most popular topics for WeChat articles for travel destinations: Nature, from flowers to snow to autumn foliage; food, including restaurant recommendations and articles on local products like berries and salmon; and several partnerships with KOLs. Vancouver also focused a lot on fitness and sports in their posts throughout the year, from running and yoga, to skiing and hockey.
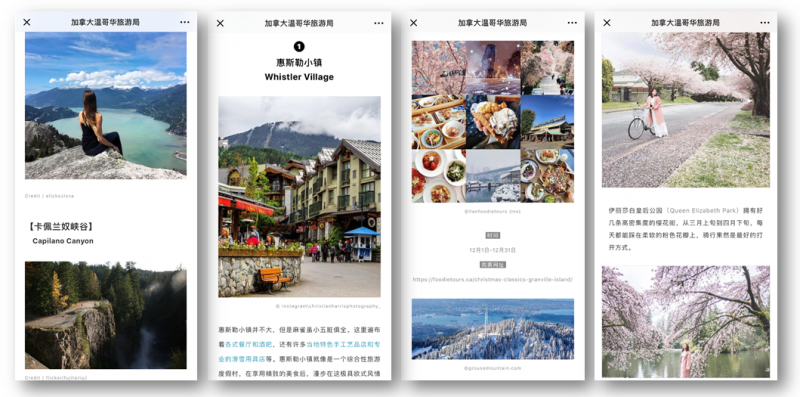
Vancouver jumped from 20th place in 2017 to 5th place in 2018, with a content strategy focused on food, the outdoors, and KOL partnerships
South Australia is another account that’s done well in 2018, moving up the rankings by two positions to 6th place, and increasing article views by 38.6%. Photos of KOLs, celebrities and tourists cuddling koalas were central to South Australia’s WeChat article content in 2018, though other wildlife such as kangaroos, seals, and alpacas also made frequent appearances. Food, wine, self-driving and beautiful scenery were the other recurring themes throughout the year. South Australia’s articles always end with flight information for China Southern Airlines’ Guangzhou-Adelaide route.
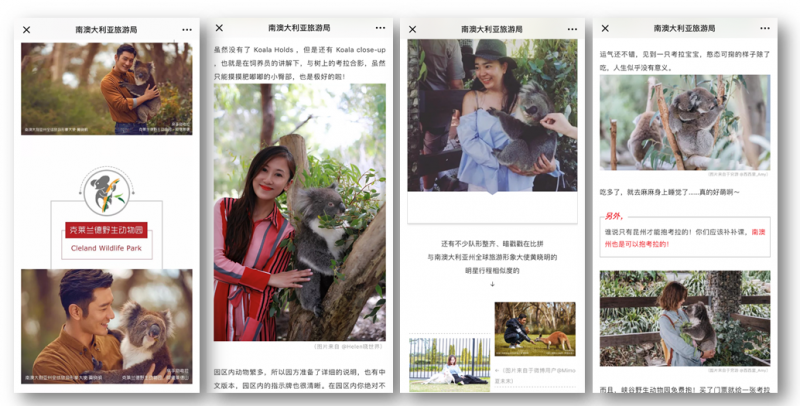
Chinese visitors cuddling koalas was a major part of South Australia’s winning 2018 WeChat strategy
World destinations
North America dominates the top DMO accounts – in the top 20, eight are cities or regions in the US, and three are in Canada. Another three are Australian, and only two (Edinburgh and Zurich) are in Europe. This may reflect the fact that a larger proportion of Chinese travelers to North America and Australia are FITs compared to Europe or other markets. The US, Canada and Australia are also all large countries, where individual regions and cities may find it more necessary and effective to do their own marketing, in addition to working with a national tourism board.
Airlines
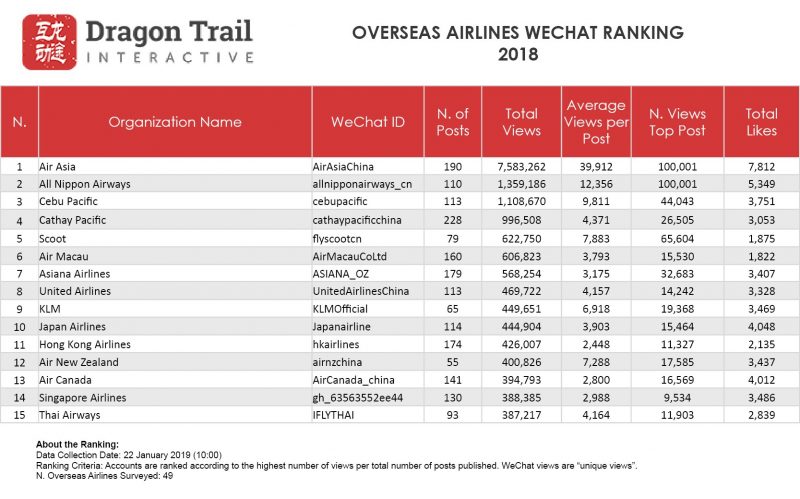
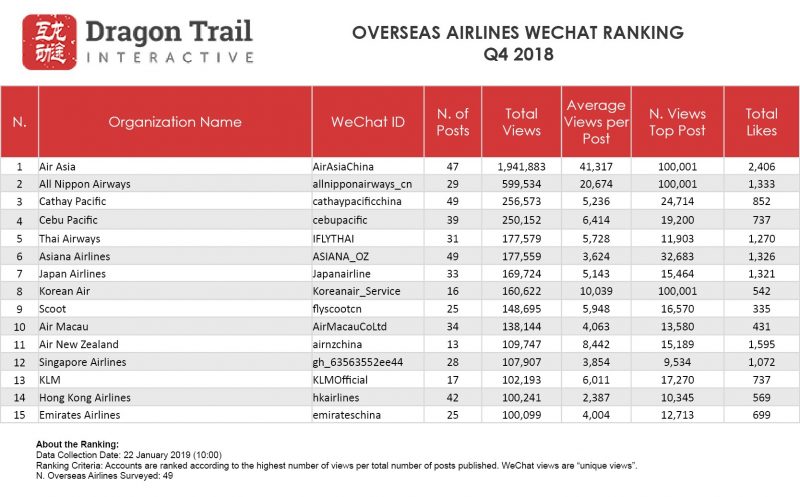
AirAsia remains firmly in 1st place for international airlines on WeChat, getting over 5.5 times the total article views as the 2nd place airline for the year, an even greater difference in total views than in 2017, when it was 5.2 times. In terms of average article views, AirAsia was slightly less competitive in 2018 but still firmly ahead – in 2017, the airline’s average article views were 4.8 times that of its closest competitor (Cebu Pacific), but in 2018, AirAsia got 3.2 times the average article views as All Nippon Airways. AirAsia aside, there has been some fluctuation in the top 5 airline accounts, with All Nippon Airways shooting up from 4th place in 2017 to 2nd in 2018. The Japanese airline increased its average article views by an astonishing 139%. Cebu Pacific remained in 3rd place, with a more modest but still respectable 14.4% increase in average post views. Cathay Pacific dropped from 2nd place to 4th place in 2018, with average article views declining a mere 1.6%. Scoot Airlines replaced United Airlines as the 5th ranking airline by total article views in 2018, moving up from 6th place in 2017, and increasing average article views by 12.5%.
United, on the other hand, dropped down to 8th place, with a 78.6% decrease in average article views. Although United dropped its services from Hangzhou in 2017, unlike American Airlines, it did not cut any flight routes from China in 2018. However, like American Airlines, United may also be facing similar competition from Chinese carriers, or even be affected by the sharp decline in bookings to the US around the October holiday period in 2018.
Success stories
All Nippon Airways started its ascent through the WeChat Rankings in 2017 and has had an extraordinarily successful year in 2018. Most of its top-ranking articles were about discounted tickets to Japan, and the airline also took advantage of the strong interest in travel to Japan in 2018, promoting the appeal of the destination as well as the flights. All Nippon Airways gave followers several opportunities to vote, with one article asking WeChat users to pick their favorite flight attendant uniform, and another with voting on one’s favorite in-flight meal.
The highest number of article views that WeChat displays is 100,000, and while AirAsia achieves this regularly throughout the year and was the only airline to do so in 2017, three other airlines passed the 100K mark in 2018: Finnair for a post on its food-and-music pairing mini-program in April, All Nippon Airways for a 12/12 promotion, and Korean Air for its competition to win Fliggy coupons at the end of December.
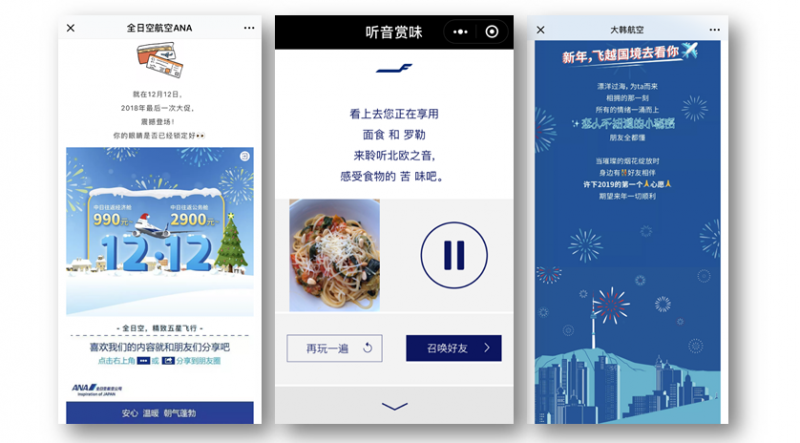
Apart from AirAsia, only three airlines got over 100,000 views for a WeChat post in 2018: (left to right) All Nippon Airways, Finnair, and Korean Air
World destinations
Asian airlines have increased their dominance on WeChat in 2018. In 2017, six out of the top 15 and three out of the top 10 ranking airlines were non-Asian. In 2018, this dropped to four and two, respectively. Outbound travel from China is predominantly to other destinations in Asia, and short-haul airlines may also find it easier to offer deals and giveaways than long-haul carriers, thanks to higher frequency, lower cost flights, and the surge in new flight routes to Asian destinations from emerging, lower-tier Chinese cities.
Cruise Lines
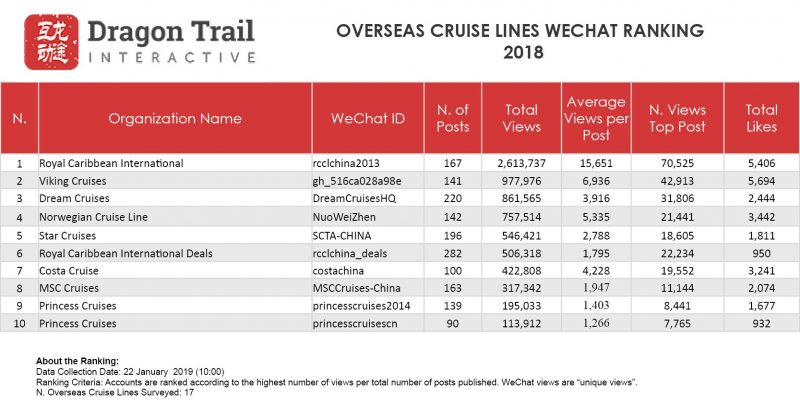
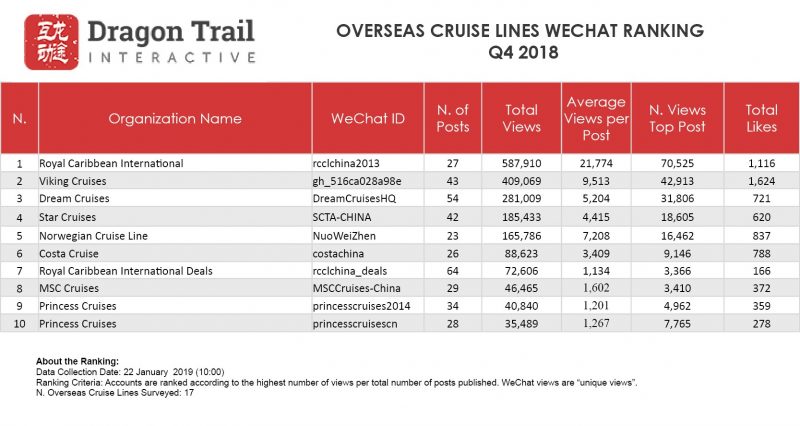
2018 saw significant changes to the WeChat performance of cruise lines, with the exception of Royal Caribbean, which easily stayed in 1st place, though its position is slightly weaker than in 2017. This year, Royal Caribbean had 2.7 times more total article views than its nearest competitor, and 2.3 times the number of average post views. In 2017, Royal Caribbean had 3.45 times more total views than the second-ranking account – but that account was also owned by Royal Caribbean and was their dedicated deals account. Although the Royal Caribbean Deals account posted slightly more articles in 2018 (282 compared to 2017’s 267), its average article views fell by 44.3%, and it ended up in 6th place. In 2017, Costa was the other big cruise line on WeChat, ranked 3rd. But Costa Cruises slipped down to 7th in 2018, posting 37% fewer articles and getting 11.9% fewer average views per article.
Meanwhile, two other cruise lines have risen up the ranks in 2018 to take the places of Royal Caribbean Deals and Costa Cruises: Viking Cruises and Dream Cruises. Dream Cruises increased average article views by 97% and jumped from 6th place to 3rd. Viking Cruises has been an even bigger success story, rising from 8th place to 2nd, with a 218.8% increase in average article views. In 4th and 5th place in 2017, respectively, Star Cruises and Norwegian Cruise Lines switched positions in 2018, with NCL increasing average views by 25%, and Star Cruises also increasing by 23.3%, but posting less often than they did in 2017, compared to NCL’s increased post numbers.
Success stories
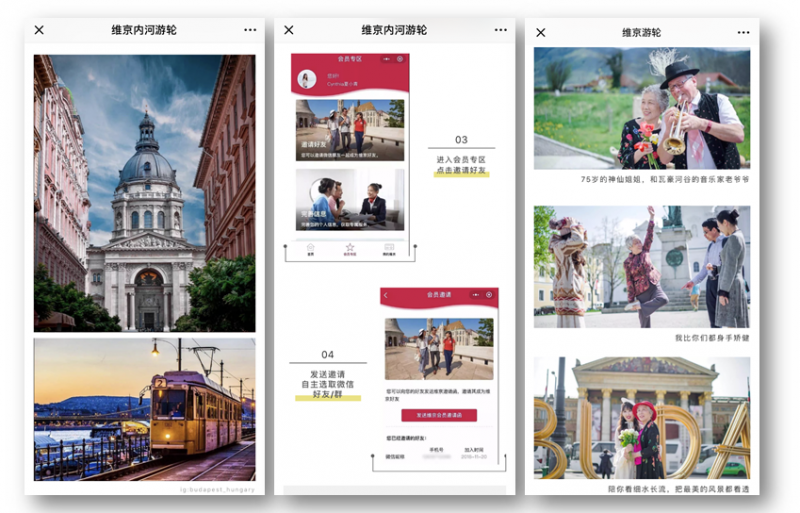
Viking Cruises has seen the most dramatic increase in WeChat rankings among travel brands in 2018
Throughout 2018, Viking Cruises’ WeChat account has shown incredible results, and of any travel brand in any category on WeChat, this is the one that’s moved up the rankings the fastest and most dramatically. What are the reasons for this? Firstly, the account has posted 50% more articles in 2018 than the year before. Second, Viking started the year with a very well received and long-running competition that got lots of people involved with the brand account, giving winners the chance to take their parents on a Rhine River cruise. Thirdly, the articles are beautiful, with lots of large, vibrant photos, maps and clear information about their products. Fourthly, European river cruises – Viking’s product – are a growing market for Chinese outbound travelers. And finally, Viking has invested significantly into WeChat advertising. This is certainly not the only account on WeChat to engage in paid promotions that distribute posts to a higher number of users, and Dragon Trail does not have the background information to be able to say exactly which other accounts and posts have been promoted in 2018. But in the case of Viking, our own team members have frequently seen Vikings’ posts promoted in their WeChat Moments throughout the year.
Museums & Attractions
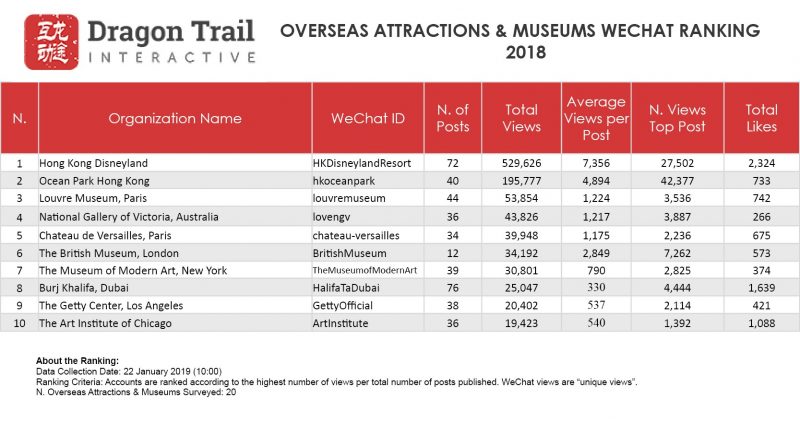
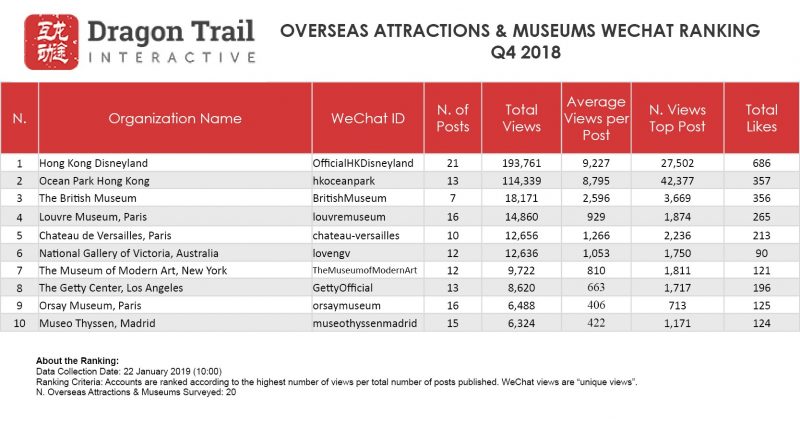
Hong Kong theme parks Disneyland and Ocean Park led the WeChat Rankings for museums and attractions throughout 2018, with Hong Kong Disneyland unopposed for 1st place. These attractions are easily accessed from the Chinese mainland, have greater mass-market appeal than art museums in long-haul destinations, and Hong Kong Disneyland also posted nearly twice as many times as any of the other accounts tracked. In 3rd through 5th place were the Louvre, the National Gallery of Victoria in Melbourne, and Versailles. Chinese tourists have shown particular interest in Parisian cultural attractions this year, and this is reflected on WeChat.
Not to be ignored in 6th place, however, is the British Museum, which barely posted at all in Q2, but ended up with double the average article views as the Louvre, and is also performing very well since the start of 2019. The British Museum launched a new Chinese website in August and gained massive attention in China after it launched a shop on the Alibaba Group’s Tmall in July.
Hotels
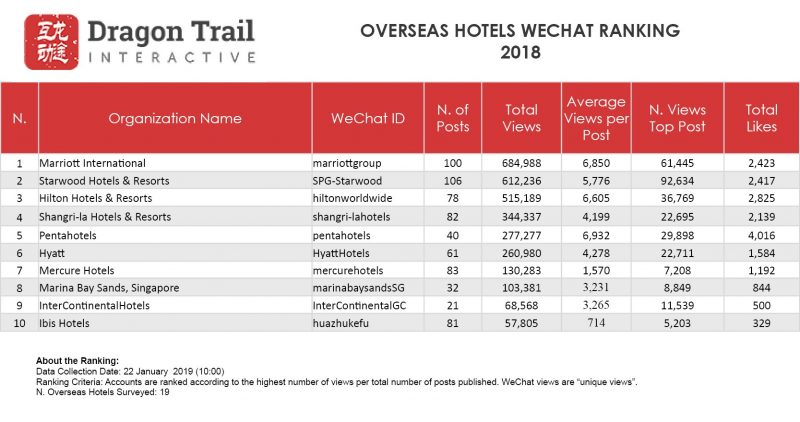
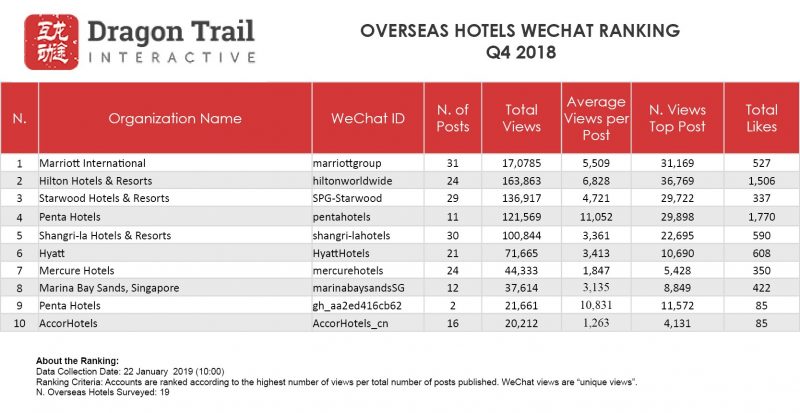
International hotels are different to the other categories tracked on WeChat in that their official account content usually relates to domestic properties rather than to overseas ones. However, brand recognition can be important for international bookings as well, and many of the big-name hotel brands use their WeChat accounts to promote their membership programs, which extend globally.
Marriott, Starwood, Hilton, and Shangri-la are ranked at the top, but 5th place is a bit more interesting – Pentahotel, a young, mid-range, boutique hotel chain, actually has the highest average views per post of any hotel account tracked, and has made major gains in Q4 as well.
The only single-property account in the top ranking list is the iconic Marina Bay Sands in Singapore. However, the results of the WeChat Rankings in this category are not a sign that overseas hotels, especially those that aren’t part of an enormous global chain, should give up on WeChat. Rather than a marketing tool with articles that reach thousands, hotels can think of WeChat as more of a service and communications tool, which Chinese guests can use for booking requests, and to get concierge recommendations, check in, Wi-Fi and other on-site services to make them feel at home.
Q4 2018 Rankings Charts
The wonderful partners we work with


Sign up for our free newsletter to keep up to date on our latest news
We do not share your details with any third parties. View our privacy policy.
This website or its third party tools use cookies, which are necessary to its functioning and required to achieve the purposes illustrated in the cookie policy. If you want to know more or withdraw your consent to all or some of the cookies, please refer to the cookie policy. By closing this banner, scrolling this page, clicking a link or continuing to browse otherwise, you agree to the use of cookies.